by Brian T. Lynch, MSW
I read a comment posted elsewhere today by an Israeli living in Israel right now during this latest conflict with Hamas in Palestine . On one side Hamas does not speak for the hearts and minds of the every day people living in Palestine. Many Palestinians feel as if they are held hostage by Hamas while Israeli shells kill innocent victims. On the other side some Israelis no longer recognize their neighbors who have grown hard and belligerent. Hate and blood-lust are spreading among the citizens, changing the character of who they are as a people. I was deeply moved. I see now that it is as if there are two Israels and two Palestines, one visible to the outside world and one hidden from view. The conflict we see hides greater conflict and suffering in the hearts and souls of people on both sides. My own heart aches for the humanity that is dying with each new casualty in this war.
Tuesday, July 29, 2014
Monday, July 28, 2014
Inequality on a Global Scale (literally)
The cartoon below is from the great editorial cartoonist Stuart Carlson. It highlights with humor a very serious global economic condition, growing wealth inequality.

http://www.gocomics.com/stuartcarlson/2014/06/20#.U9Zns_ldXfJ (Go and enjoy his other cartoons.)
Allow me to breakdown the math for you. These figures work out to an average of $486 per poor person vs. $20 billion per rich person. This is not a measure of income but a measure of wealth, or capital.
Another important math fact from this illustration: If you have $20 billion in capital and earn an average return on investments of 4% a year, and if you lavishly spend $1 million per month on your lifestyle, at the end of 50 years you will still have $140 billion left for your children to inherit. That's right, if you have seven children they would each get close to the 20 billion that you started out with.
This is the crisis of capital that we face. This fact is among the findings of economist Thomas Piketty in his recent book, Capital in the Twenty-First Century. Within just a few generations almost all the wealth on the planet will be handed down from parents to children. Almost no new fortunes will be made through the earnings of those who have to work for a living. We will effectively return to a feudal system even here in the United States and abroad. The phenomenon is global. The quicker national and global population stabilize or decline the faster wealth will concentrate among the wealthy.
All we have to do to return to a feudal society is... do nothing.
Someone on facebook asked me, "Is it really the zero-sum game that these breakdowns of wealth distribution always seem to imply?" Good question! Is it the case that the growing wealth of the wealthy must come at the expense of growing poverty Or, doesn't the growth of capital lift all ships?
When you look at national and global income-to-capital averages you see what looks like fairly stable ratios. Growing capital wealth and growth in income seem to balance. But look a littler closer and you see that more of the population falls into poverty as the value of capital grows at compounded rates. So yes, there is more national income, but there is an ever larger percentage of income coming from capital investments and going to the wealthy. As capital becomes the main source of income, the real earnings of wage earners stretches and collapses at the lower end of the economic scale. For the middle class, it is like being caught between the gravitational fields of two black holes... one created by poverty and the other by capital wealth
Sunday, July 27, 2014
War "Statistics": The New York Times Deceives Again
* * * G U E S T B L O G G E R * * *
by Gil Lavi
July 25, 2014
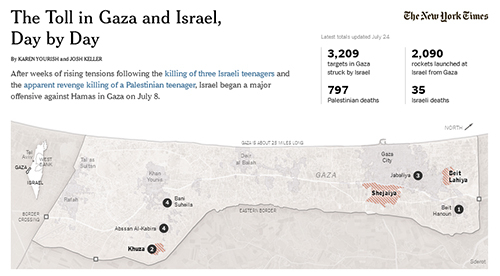
The "Daily Tally" in the New York Times, a casual-sounding infographic, presents a side-by-side count of casualties and missiles in Gaza and Israel. Although it is ostensibly one of the clearest representations of violence, it is seriously misleading.
War photography can be powerful, moving, and shocking; and data to prove a point can be reassuring, if often falsely. It is the very power of numbers, graphics, and photographs that makes them at the same time compelling ways to prove a point, and lousy ways of explaining what is really going on.
During World War II, it is estimated that 378,000 German civilians were killed in British air raids, compared to only 62,000 British civilians killed in German air raids. Knowing this, however, does little to help understand the nature of the conflict.
The New York Times's Daily Tally is as political as the map represented in it. The visualization quantifies two elements related to the conflict: the number of deaths, and the number of attacks. It does not reveal who started the latest round of battle or why; who the dead are; how many civilians live under constant threat of indiscriminate shooting, or how that number accumulated over time. The numbers simply attempt authoritatively to represent an amount violence in the air, devoid of all context.

The New York Times "Daily Tally" infographic is seriously misleading, its numbers devoid of all context. (Image source: Screenshot of nytimes.com)
Karen Yourish and Josh Keller, its authors, refer to these hostilities as another volley in the "Israeli-Palestinian Conflict." They could just as easily, and more accurately, have framed the events as, "the conflict between Israel, Hamas and its Palestinian hostages." I suggest this as a title because it signals to viewers that this conflict is more nuanced than the black-and-white conflict presented. Most Palestinians might even reject Hamas's aggression towards Israel: a 2013 survey conducted by the Ramallah-based organization, Arab World for Research & Development wrote that 65% of Palestinians opposed a new intifada, 95% of Gazans supported a new round of elections, and 44% of Palestinians preferred the Fatah approach.
The Daily Tally, favoring a more simplistic formula that implicitly frames the conflict as one between good and evil, obfuscates these distinctions. It also neglects to inform readers that as many as 70% of the Israelis support a Palestinian state backed by the UN, according to a survey done by Hebrew University's Harry S. Truman Research Institute. Instead, the Daily Tally simply demands to be frequently refreshed -- counting the dead while ignoring the demands of the living.
Maps, images, and infographics can, of course, easily become the instruments of promoting particular political ideologies, and might even have been chosen for that reason. By choosing to represent only particular aspects of a story, however, the people who post the Daily Talley know they are capable of swaying opinion and motivating viewers to think about a situation in a particular way. But that is not "all the news that is fit to print;" that is propaganda.
Creating compelling clickbait in the form of infographics is a disturbing trend in news today. Journalists would be more credible if, instead, they were even interested in embracing a more complete approach to communicating authentic stories, rather than competing for the bloodiest image. It would be refreshing if journalists would recommit themselves to promoting the truth, as closely as they could, behind the images and numbers they present. In promoting this partial and often false knowledge, it is easy to inculcate a misguided sense of righteousness on both sides. In the search for truth, infographics, images, and numbers give only the illusion of knowledge. The real thing often looks quite different.
Gil Lavi is a writer and former Middle East news photographer who focuses in his work on the research of images, maps and graphics from the Middle East.
Originally published by Gatestone Institute
Wednesday, July 16, 2014
Water, Detroit and the Essentials of Life
by Brian T. Lynch, MSW
Recent news accounts of the massive water shut-offs by the City of Detroit has drawn national and international attention to this essential utility that we sometimes take for granted. Over 17,000 residents have had their water shut off in that city for non-payment. About 12% of the 90,000 Detroit utility customers are delinquent by more than 60 days, and nearly half of the water customers are behind in payments (the latter fact according to an LA Times report). Since April of this year the city has targeted shut offs for 4,000 residents per week who are $150 or more in arrears.
Recent news accounts of the massive water shut-offs by the City of Detroit has drawn national and international attention to this essential utility that we sometimes take for granted. Over 17,000 residents have had their water shut off in that city for non-payment. About 12% of the 90,000 Detroit utility customers are delinquent by more than 60 days, and nearly half of the water customers are behind in payments (the latter fact according to an LA Times report). Since April of this year the city has targeted shut offs for 4,000 residents per week who are $150 or more in arrears.
Image Credit: www.waterpurifier.org

The delinquency rates aren't new. Detroit is a shrinking city with lots of poor residents left behind. The city is bankrupt. The aggressive enforcement measures towards those behind in their bill is new. City management official claim that the water and sewer utility has been plagued by corruption, incompetence and inadequate maintenance for decades, and is seriously in debt. The utility's bond rating is Baa with $5.4 billion in bond obligations. Moody's Financial Ratio Analysis places the utilities debt ratio at around 90%.
Detroit is currently run by an appointed emergency manager selected by the Governor under a controversial new Michigan law. The emergency manager supersedes all elected authority in the city and has nearly absolute power. Pressure to shut off delinquent residential water customers comes under his authority.
There is also a water and sewer industry report prepared in 2012/2013 by Black and Veatch, a private firm. This report says the cost of water in Seattle, for example, was $8.19 per 1.000 gallons, not including the sewer charges. The combined monthly bill for sewer and water in Seattle was $177.93 per month for residential customers using 7,500 gallons, according to this report.
Meanwhile in Detroit, according to the Black and Veatch report, the monthly water and combined sewer and water rates for residential customers using 7500 gallons per month was $24.12 and 70.89 respectively. So which figures are correct?
It turns out that water and sewer utility prices are deceptively difficult to understand or to compare from city to city. There are different units of measurement, different seasonal schedules, peak and off-peak metering and different rate structures. Also, in cities especially, water and sewer rates are separately billed but inseparable because water use is the measure of sewer use in most cases. Billing is combined. Sewer rates are generally higher, often double the water rates. Comparing water pricing without including sewer pricing can be very misleading. Finally, to get a full picture of a municipal utility overall, it is important to compare the rates for commercial water/sewer uses and the wholesale rates the utility charges industries.
An Apples to Apples Comparison
The table below directly compares the published water and sewer rates for Detroit and Seattle (converted to dollars/1,000 gallons). Seattle was selected for comparison because it was one of the cities mention in the USA Today article as having the highest rates. The data is from both city websites.

At first look it appears that Seattle water and sewer prices are significantly higher than in Detroit. The average Seattle resident uses 3,740 gallons of water per month for a combined water/sewer bill of $112/mo. compared with $62/mo. in Detroit. But when you take a closer look you see that Seattle has a two tier residential rate. The published rate is for residents who can afford it while those families making less than 70% of the city's median income receive a 50% discount. The discount only applies to low wage families who aren't eligible for HUD (Section 8) federal assistance, and the municipal utility actively helps low wage customers apply for federal aid if eligible. They also have programs to help families conserve water and they have very flexible payment plans for any residents who fall behind according to the spokesperson with whom I talked. Shutting off water to a customer would not be considered for residents who owe less than around $1,000.
Detroit, a city with a median family income 25% lower than Seattle, has flat rates. It offers no low income discounts. As a result, the average low income water/sewer bill in Detroit is higher than in Seattle.
To complete the look at water and sewer utilities in these two cities it is important to compare rates for retail commercial and wholesale water customers as well. The information on the websites is a little more difficult to extract in this area. The graph below is my best attempt.


What jumps out here is the different rate structures in these two cities. Commercial rates in Seattle are somewhat higher than in Detroit, the monthly minimum and maximum wholesale facility charges are significantly higher. Seattle also has a peek commercial water rate that is higher than off-peak to encourage conservation. Meanwhile the difference in the maximum and minimum facility charges in the two cities is 13 times and 38 times higher in Seattle. This suggests that there may be some latitude for Detroit to raise commercial and wholesale water/sewer utility rates to help offset the current financial short fall. Additionally, the Detroit utility could also consider raising residential rates for customers who can afford the increase and discounting rates for low wage earners, as Seattle does.
In the meantime, Detroit should look at the creative collection alternative already practiced in other states and try to find effective alternatives to shutting off water to so many of the residents they are honor bound serve. Access to water is an essential human right and cutting off resident from water should be a last resort. Just reviewing the rate structure suggests possibilities that may not have been considered yet.
A Global Perspective
How do U.S. water rate compare with the cost of water in other cities around the world?
The Organization for Economic Co-operation and Development ( OECD ) conducted two surveys of residential water tariffs in 1999 and in 2007-08, using a reference consumption of 15 cubic meters per household per month. The 2007-08 survey covered more than 150 cities in all 30 OECD member countries. The survey does not claim to be representative. The OECD survey was complemented by a survey of the industry information service Global Water Intelligence (GWI) conducted in 2007-2008 in parallel with the second OECD survey. The 2008 GWI survey covered 184 utilities in OECD countries and 94 utilities in non-OECD countries. GWI has repeated its survey every year from 2009 to 2012, increasing the number of utilities surveyed to 310 in 2012.
When you convert the OECE findings to US gallons the results indicate that the average water rate in the 310 global cities surveyed is $7.50/1,000 gallons. The range of water rates vary greatly from $0.11 per 1,000 gal. in Saudi Arabia, to $34.86 per 1,000 gal. in Denmark. Then there are also countries, such as Ireland, where water is delivered to households free of charge.
The benchmark for monthly water use in the OECD survey was 15 cubic meters per month, or 3,963 gallons per month, compared with 7,481 gallons per month in the United States. As the graph below shows, U.S. households use more water than do households in most other countries. In the examples above, the difference represents an 88% higher rate of water use in the U.S.


To complete the comparison it is important to acknowledge that higher volumes of water used per household in the US lowers the cost per gallon. In the USA TODAY article, greater conservation of water by customers was named as one of the reasons for higher water rates. When you factor in the average water use in the US with the benchmark estimate of average monthly use in the OECD study, residents in Atlanta, Seattle and San Diego are paying approximate $50 per month for water while residents in foreign cities are paying about $30 per month.
If U.S. water consumption dropped to the lower global levels, residents in the cities mentioned above would pay about $27 dollars per month. However, lowering water use that much in the U.S. would significantly raise the cost per gallon. There are so many variables and assumptions in all of the underlying data that this is a rough guess.
Keep in mind also that the cost of water for the data cited here is for cities, yet it isn't clear if the figures given include sewer costs. The quality of sewer systems and their associated costs vary greatly, both nationally and across the globe. The best that we can gather from this very rough comparison, then, is the impression that current water rates in the U.S. are somewhat comparable with average global rates.
Water is an essential part of our daily life and a human right. It is a finite resource that is growing in scarcity. Social and environment forces are combining to raise water prices everywhere. The trend in rising prices is likely to accelerate as U.S. water conservation become more essential to meet our basic water needs, and this article doesn't even touch on agricultural where most of our water is used. With scarcity comes increased commercial opportunities and there will be growing pressure to privatize municipal water utilities for profit. Balancing commercial interests with human needs and human rights is a conversation we need to have. Increasing public awareness is critically important for our future and the media will need to do more and better reporting to inform the public.
The delinquency rates aren't new. Detroit is a shrinking city with lots of poor residents left behind. The city is bankrupt. The aggressive enforcement measures towards those behind in their bill is new. City management official claim that the water and sewer utility has been plagued by corruption, incompetence and inadequate maintenance for decades, and is seriously in debt. The utility's bond rating is Baa with $5.4 billion in bond obligations. Moody's Financial Ratio Analysis places the utilities debt ratio at around 90%.
Detroit is currently run by an appointed emergency manager selected by the Governor under a controversial new Michigan law. The emergency manager supersedes all elected authority in the city and has nearly absolute power. Pressure to shut off delinquent residential water customers comes under his authority.
The move to turn off the water is controversial on several levels. Delinquent commercial and industrial customers are apparently not being targeted for cut offs. Residents claim their bills are excessive and State assistance isn't forthcoming with any assistance. Community organizations have appealed to the United Nations. The U.N. recognizes access to water as a basic human right and holds that it is a violation of human rights to cut off people who legitimately cannot pay. The Detroit authorities claim that many residents intentionally don't pay water bills, thus contributing to the crisis, a claim that citizen advocacy groups deny. There are rumors that the municipal owned utility might be sold to a private company, raising suspicions that this has been the plan all along. The water shut off policy has lead to angry street protests.
To understand Detroit's situation it is helpful to step back first and look more broadly at water utilities here and abroad.
Water Utility Rates are on the Rise
To understand Detroit's situation it is helpful to step back first and look more broadly at water utilities here and abroad.
Water Utility Rates are on the Rise
An article last year by Brett Walton at the "Circle of Blue" reported that: "Water prices in 30 major U.S. cities again grew at a pace faster than inflation, according to Circle of Blue’s annual survey of water rates for single-family residential customers. Water prices increased an average of 6.7 percent in these metropolitan areas, a slower rate than in recent years but well above the 2.1 percent increase in the U.S. Bureau of Labor Statistics’ Consumer Price Index for 2012. The median increase in water prices was 6.2 percent."
A 2000 survey by the U.S. Census Bureau found that, "The average annual cost of water and waste water for a household that pays directly for service is $476 per year, ranging from $334 in Nebraska to $721 in Hawaii." That figure works out to about $40 per month while an EPA website says: "American household spends, on average, only $523 per year on water and waste water charges... " That works out to a U.S. average of $43.58 per month for water and sewer.
In a recent USA TODAY article entitled "Nation's water costs rushing higher" it was reported that:
"While most Americans worry about gas and heating oil prices, water rates have surged in the past dozen years, according to a USA TODAY study of 100 municipalities. Prices at least doubled in more than a quarter of the locations and even tripled in a few.[snip] Monthly costs topped $50 for consumers in Atlanta, Seattle and San Diego who used 1,000 cubic feet of water, a typical residential consumption level in many areas.
There is also a water and sewer industry report prepared in 2012/2013 by Black and Veatch, a private firm. This report says the cost of water in Seattle, for example, was $8.19 per 1.000 gallons, not including the sewer charges. The combined monthly bill for sewer and water in Seattle was $177.93 per month for residential customers using 7,500 gallons, according to this report.
Meanwhile in Detroit, according to the Black and Veatch report, the monthly water and combined sewer and water rates for residential customers using 7500 gallons per month was $24.12 and 70.89 respectively. So which figures are correct?
It turns out that water and sewer utility prices are deceptively difficult to understand or to compare from city to city. There are different units of measurement, different seasonal schedules, peak and off-peak metering and different rate structures. Also, in cities especially, water and sewer rates are separately billed but inseparable because water use is the measure of sewer use in most cases. Billing is combined. Sewer rates are generally higher, often double the water rates. Comparing water pricing without including sewer pricing can be very misleading. Finally, to get a full picture of a municipal utility overall, it is important to compare the rates for commercial water/sewer uses and the wholesale rates the utility charges industries.
An Apples to Apples Comparison
The table below directly compares the published water and sewer rates for Detroit and Seattle (converted to dollars/1,000 gallons). Seattle was selected for comparison because it was one of the cities mention in the USA Today article as having the highest rates. The data is from both city websites.
At first look it appears that Seattle water and sewer prices are significantly higher than in Detroit. The average Seattle resident uses 3,740 gallons of water per month for a combined water/sewer bill of $112/mo. compared with $62/mo. in Detroit. But when you take a closer look you see that Seattle has a two tier residential rate. The published rate is for residents who can afford it while those families making less than 70% of the city's median income receive a 50% discount. The discount only applies to low wage families who aren't eligible for HUD (Section 8) federal assistance, and the municipal utility actively helps low wage customers apply for federal aid if eligible. They also have programs to help families conserve water and they have very flexible payment plans for any residents who fall behind according to the spokesperson with whom I talked. Shutting off water to a customer would not be considered for residents who owe less than around $1,000.
Detroit, a city with a median family income 25% lower than Seattle, has flat rates. It offers no low income discounts. As a result, the average low income water/sewer bill in Detroit is higher than in Seattle.
To complete the look at water and sewer utilities in these two cities it is important to compare rates for retail commercial and wholesale water customers as well. The information on the websites is a little more difficult to extract in this area. The graph below is my best attempt.
What jumps out here is the different rate structures in these two cities. Commercial rates in Seattle are somewhat higher than in Detroit, the monthly minimum and maximum wholesale facility charges are significantly higher. Seattle also has a peek commercial water rate that is higher than off-peak to encourage conservation. Meanwhile the difference in the maximum and minimum facility charges in the two cities is 13 times and 38 times higher in Seattle. This suggests that there may be some latitude for Detroit to raise commercial and wholesale water/sewer utility rates to help offset the current financial short fall. Additionally, the Detroit utility could also consider raising residential rates for customers who can afford the increase and discounting rates for low wage earners, as Seattle does.
In the meantime, Detroit should look at the creative collection alternative already practiced in other states and try to find effective alternatives to shutting off water to so many of the residents they are honor bound serve. Access to water is an essential human right and cutting off resident from water should be a last resort. Just reviewing the rate structure suggests possibilities that may not have been considered yet.
A Global Perspective
How do U.S. water rate compare with the cost of water in other cities around the world?
The Organization for Economic Co-operation and Development ( OECD ) conducted two surveys of residential water tariffs in 1999 and in 2007-08, using a reference consumption of 15 cubic meters per household per month. The 2007-08 survey covered more than 150 cities in all 30 OECD member countries. The survey does not claim to be representative. The OECD survey was complemented by a survey of the industry information service Global Water Intelligence (GWI) conducted in 2007-2008 in parallel with the second OECD survey. The 2008 GWI survey covered 184 utilities in OECD countries and 94 utilities in non-OECD countries. GWI has repeated its survey every year from 2009 to 2012, increasing the number of utilities surveyed to 310 in 2012.
When you convert the OECE findings to US gallons the results indicate that the average water rate in the 310 global cities surveyed is $7.50/1,000 gallons. The range of water rates vary greatly from $0.11 per 1,000 gal. in Saudi Arabia, to $34.86 per 1,000 gal. in Denmark. Then there are also countries, such as Ireland, where water is delivered to households free of charge.
The benchmark for monthly water use in the OECD survey was 15 cubic meters per month, or 3,963 gallons per month, compared with 7,481 gallons per month in the United States. As the graph below shows, U.S. households use more water than do households in most other countries. In the examples above, the difference represents an 88% higher rate of water use in the U.S.
To complete the comparison it is important to acknowledge that higher volumes of water used per household in the US lowers the cost per gallon. In the USA TODAY article, greater conservation of water by customers was named as one of the reasons for higher water rates. When you factor in the average water use in the US with the benchmark estimate of average monthly use in the OECD study, residents in Atlanta, Seattle and San Diego are paying approximate $50 per month for water while residents in foreign cities are paying about $30 per month.
If U.S. water consumption dropped to the lower global levels, residents in the cities mentioned above would pay about $27 dollars per month. However, lowering water use that much in the U.S. would significantly raise the cost per gallon. There are so many variables and assumptions in all of the underlying data that this is a rough guess.
Keep in mind also that the cost of water for the data cited here is for cities, yet it isn't clear if the figures given include sewer costs. The quality of sewer systems and their associated costs vary greatly, both nationally and across the globe. The best that we can gather from this very rough comparison, then, is the impression that current water rates in the U.S. are somewhat comparable with average global rates.
Water is an essential part of our daily life and a human right. It is a finite resource that is growing in scarcity. Social and environment forces are combining to raise water prices everywhere. The trend in rising prices is likely to accelerate as U.S. water conservation become more essential to meet our basic water needs, and this article doesn't even touch on agricultural where most of our water is used. With scarcity comes increased commercial opportunities and there will be growing pressure to privatize municipal water utilities for profit. Balancing commercial interests with human needs and human rights is a conversation we need to have. Increasing public awareness is critically important for our future and the media will need to do more and better reporting to inform the public.
Friday, July 4, 2014
July 4th - What I Celebrate
We are the first nation on Earth founded on principles of human government rather than tribe, race, religion, culture or any other accident of birth. That is what I celebrate today. I celebrate a nation that serves a richly diverse people, respecting the human rights of each person under a system of equal justice for all, while protecting us and promoting our common welfare according to the will of ordinary citizens. Today I do not celebrate this land, which I do love, or our great accomplishments, of which I am proud, but rather the principles on which we were founded. And if we find that we are not living up to those founding principles as best we should, this is the day to renew our commitment to live by those principle that truly define us as Americans.
Friday, June 27, 2014
Oklahoma Earthquakes Shaking Up Fracking Politics
by Brian T. Lynch, MSW
[see updates below]
Earthquakes in Oklahoma are shaking up the politics of its natural gas friendly state government. According to a June 27th article in Energy Wire, Oklahoma's Corporation Commission, under public pressure, will start collecting information and test data on underground injection wells.

The problem is that Oklahoma has become seismically active. Between the months of October and May Oklahoma had more magnitude 3.0 or larger earthquakes (189) than California (with 139). Other reports state that the total number of quakes in Oklahoma is double the number in California. The locations of the quakes closely correspond with fracking sites. State regulators say to need more evidence of the correlation despite the stack of scientific, peer reviewed studies supporting the correlations.
Energy Wire report:
The U.S. Geological Survey reported 40 earthquakes greater than magnitude 2.5 around the world yesterday as of midafternoon -- six of them were in Oklahoma and three were outside this suburb of Oklahoma City.
"You can hear them coming," said Mary Ternes, who lives near Edmond. "You can hear the rumble and then the house shakes."
The largest quake so far measured 5.7 and killed two people back in 2011, but the risk of higher magnitude quakes is growing.
While Oklahoman's are beginning to come out in significant numbers to public hearings to complain, state officials and regulators are taking starting to take the first step to address their concerns.
Energy Wire:
New rules on injection wells, approved by Republican Gov. Mary Fallin last week, will require operators to perform more frequent mechanical integrity tests of disposal wells and keep daily records of the amount of fluids they inject and the pressures they use.
Meanwhile, Skinner said, state regulators have told operators to shut in several injection wells for minor violations such as excessive pressure. The Corporation Commission also held formal hearings on two injection wells proposed near existing faults and asked the operators to do additional monitoring as a condition of approval. Previously, most injection well permits were approved administratively.
According to The Oklahoman newspaper about four-hundred worried resident of Edmond, Oklahoma came out to a meeting this past Thursday evening to express their fear and concerns. Many of them had been awakened by a magnitude 3.5 quake near Edmond in the wee hours of that same morning.
The Oklahoman report:
Oklahoma Geological Survey seismologist Austin Holland said there is no way to know what has caused the unprecedented increase in earthquakes in Oklahoma, although several studies have linked temblors to oil and natural gas activity, particularly wastewater injection wells.
Many residents were no happy with the answers they got at the meeting.
the problem isn't just happening in Oklahoma it's happening in Texas and Ohio and many other states where fracking operations are taking place. Alan Brundrett, the mayor of a small town call Azle, in North Texas, said his town has experienced an unusual number of earthquakes. He is upset by the lack of data and transparency of local fracking operations that make it hard to assess the issues.
According to an Al Jazeera report:
Brundrett said the Texas Railroad Commission would not draw a link between fracking activities and earthquakes in the meeting, but promised to investigate the matter further.
Ramona Nye, who handles media relations for the Railroad Commission, told Al Jazeera in an emailed statement that the agency "does not have the jurisdictional authority to shut down an injection well based only on the presence of a nearby earthquake.
"There has been no scientific proof that a specific well or wells have caused the Azle-area earthquakes," she said, adding that the commission had hired a seismologist in April who is working to determine any links between fracking and earthquakes.
State geologists in Ohio have already made the case that the quake activity there is the result of fracking activity.
According to a report from International Business Times:
Fracking involves pumping water, sand and chemicals down into wells and horizontal pipes to crack open rock and extract oil and gas. Often, the wastewater created is dumped back into the ground, which according to the U.S. Geological Survey, is linked to a sixfold increase in earthquakes from 2000 to 2011. [snip]
ast month, Ohio regulators indefinitely shut down Hilcorp Energy’s fracking operation near the Pennsylvania border after five earthquakes, one of 3.0 magnitude, rattled Ohioans.
According to Oil Price.Com, an oil and energy news site:
In March, 2014. there was a study entitled “Potentially induced earthquakes in Oklahoma, USA: Links between wastewater injection and that 2011 Mw 5.7 earthquake sequence,” [snip]The study
focused its research on seismic activity in Oklahoma over the past two years and concluded that a 4.8-magnitude earthquake centered near Prague on 5 November 2011, was "induced" by the injection wells. Two subsequent earthquakes, including a 5.7-magnitude “event” the following day, was the biggest in contemporary state history, were caused by the first earthquake and existing tectonic stresses in the earth.
The growing body of scientific evidence and the growing public concern about fracking are reaching a critical mass and even the most business friendly politicians are starting to feel the ground shift.
Webliography
http://www.koco.com/weather/oklahoma-more-than-doubles-california-in-earthquakes/26673322#!4Xjx3
http://www.eenews.net/energywire/2014/06/27/stories/1060002069
http://newsok.com/edmond-earthquake-town-hall-leaves-attendees-unsatisfied/article/4972923
http://america.aljazeera.com/articles/2014/5/13/texas-fracking-earthquakes.html
http://america.aljazeera.com/articles/2014/5/13/texas-fracking-earthquakes.html
http://www.ibtimes.com/ohio-says-fracking-caused-earthquakes-will-require-drilling-companies-monitor-seismic-1571443
http://oilprice.com/Energy/Energy-General/More-Scientific-Evidence-Linking-Fracking-and-Earthquakes.html
Posted 1 minute ago by Brian Lynch
UPDATES:
Wednesday, June 18, 2014
"Serve and Protect" or "Enforce and Collect" The Changing Character of Local Police
by Brian T. Lynch, MSW
Police come in two basic flavors, I was once told, the "serve and protect" peace officers and the "enforce and collect" officers. These represent (in overly simplified terms) two fundamentally different and incompatible philosophies that are competing for the heart and soul of the profession. I needn't mention which view is winning out since 9/11. Still, the drama playing out among departments also plays out within departments, which may account for some of the local police department infighting described in a recent WNYC News article and how it is costing New Jersey taxpayers. You might not see it at first, but so often the emotional motivations behind what seems like petty disputes are really underlying rifts involving fundamentally different world views. That's what I suspect is happening here in New Jersey and elsewhere around the country, although the WNYC article doesn't mention this.
http://j.mp/1nP5kBV

I had a good friend who spent his entire career in local police departments. He dedicated himself to serving the public. Sometimes that meant arresting people who endangered others or disturbed the peace, but it also meant engaging with people in the community and going the extra mile to help out local residents in a pinch. In small towns especially it isn't "all bad guys all the time". Narrowing the focus of police work to strictly law enforcement activity results in a jaunted view of the community. My friend was never cynical or jaded by his work, but his outlook on small town policing set him at odds with a segment of his fellow officers. It played out in many internal conflicts and seemingly irrational personnel decisions over the course of his career. In the end he retired early, in part because the hostility he felt in the workplace had taken its toll.
I have other police officer friends, some who are of the "enforce and collect" variety who received negative attention in their careers whenever they strayed a bit from that philosophy. Another person I know who aspires to be a police officer was turned off by the militancy and hardnosed cynicism built into the police training curriculum. Just what does the current police training curriculum look like these days? The public should be asking this question.
What all this really means is that the drama playing out in society as a whole between ultra-conservative ideologies and more mainstream thinking is also playing out in all our public institutions, including police agencies. Local departments are not immune to what affects society as a whole. What's different here is that even small, local police departments shun transparency. While they work for the public they tend to view us as civilians outside of their fraternity. It is hard to penetrate a Departments cultural view. At the same time, there is clearly money and military style equipment flowing into even local law enforcement agencies, which serves to alter the character of local policing.
These changes are real. What is missing, in addition to transparency, is a robust public debate on what role we want local police to play in our communities. Are we aware of the changes character of our local police departments and are we comfortable with those changes?
Police come in two basic flavors, I was once told, the "serve and protect" peace officers and the "enforce and collect" officers. These represent (in overly simplified terms) two fundamentally different and incompatible philosophies that are competing for the heart and soul of the profession. I needn't mention which view is winning out since 9/11. Still, the drama playing out among departments also plays out within departments, which may account for some of the local police department infighting described in a recent WNYC News article and how it is costing New Jersey taxpayers. You might not see it at first, but so often the emotional motivations behind what seems like petty disputes are really underlying rifts involving fundamentally different world views. That's what I suspect is happening here in New Jersey and elsewhere around the country, although the WNYC article doesn't mention this.
http://j.mp/1nP5kBV
Good Cop, Bad Cop: How Infighting Is Costing New Jersey Taxpayers
Tuesday, June 17, 2014
WNYC
In the opening account in this article a female officer in Camden, New Jersey, is made Chief of Police. When she inspects the unmarked car that comes with her new promotion she discovers that one of her fellow officers planted crack cocaine in the vehicle to derail both her promotion and her career. Incidents like this reveal just how serious the clash of ideologies can be. In this case it may involve attitudes towards woman. In another example elsewhere in New Jersey an officer was handed a 30 day suspension for loosing an $8 Slim Jim. Such punishments often convey a more personal message.
I had a good friend who spent his entire career in local police departments. He dedicated himself to serving the public. Sometimes that meant arresting people who endangered others or disturbed the peace, but it also meant engaging with people in the community and going the extra mile to help out local residents in a pinch. In small towns especially it isn't "all bad guys all the time". Narrowing the focus of police work to strictly law enforcement activity results in a jaunted view of the community. My friend was never cynical or jaded by his work, but his outlook on small town policing set him at odds with a segment of his fellow officers. It played out in many internal conflicts and seemingly irrational personnel decisions over the course of his career. In the end he retired early, in part because the hostility he felt in the workplace had taken its toll.
I have other police officer friends, some who are of the "enforce and collect" variety who received negative attention in their careers whenever they strayed a bit from that philosophy. Another person I know who aspires to be a police officer was turned off by the militancy and hardnosed cynicism built into the police training curriculum. Just what does the current police training curriculum look like these days? The public should be asking this question.
What all this really means is that the drama playing out in society as a whole between ultra-conservative ideologies and more mainstream thinking is also playing out in all our public institutions, including police agencies. Local departments are not immune to what affects society as a whole. What's different here is that even small, local police departments shun transparency. While they work for the public they tend to view us as civilians outside of their fraternity. It is hard to penetrate a Departments cultural view. At the same time, there is clearly money and military style equipment flowing into even local law enforcement agencies, which serves to alter the character of local policing.
These changes are real. What is missing, in addition to transparency, is a robust public debate on what role we want local police to play in our communities. Are we aware of the changes character of our local police departments and are we comfortable with those changes?
I just learned of a new report out by the ACLU on the militarization of our police. Of the report they say, "Our neighborhoods are not war zones, and police officers should not be treating us like wartime enemies. Any yet, every year, billions of dollars’ worth of military equipment flows from the federal government to state and local police departments. Departments use these wartime weapons in everyday policing, especially to fight the wasteful and failed drug war, which has unfairly targeted people of color.
You can read their report here: https://www.aclu.org/sites/default/files/assets/jus14-warcomeshome-report-web-rel1.pdf
----------------------------------------------------
----------------------------------------------------
Related Stories on
this Blog
Three People Die in Police Custody Every Day
http://aseyeseesit.blogspot.com/2015/04/three-people-die-daily-in-police-actions.html
Police Action Fatalities in America
http://aseyeseesit.blogspot.com/2015/04/police-action-fatalities-in-america.html
New Data Exposes Racial Bias in Fatal Police Encounters
Nationwide
http://aseyeseesit.blogspot.com/2015/04/new-data-exposes-racial-bias-in-fatal.html
Police Homicides, What We Know and Don't Know
http://aseyeseesit.blogspot.com/2014/09/police-homicides-what-we-know-and-dont.html
Police Killings Not Uncommon, Exact Numbers Are Unknown
http://aseyeseesit.blogspot.com/2014/08/police-killings-not-uncommon-exact.html
Consequences of Militarized Police Departments in America
http://aseyeseesit.blogspot.com/2012/05/consequences-of-militarized-police.html
Stop-and-Frisk and Racial Profiling, What We Should Know
http://aseyeseesit.blogspot.com/2012/06/stop-and-frisk-and-racial-profiling.html
Sunday, June 15, 2014
Kids in Cages - Humanitarian Crisis At Our Borders
by Brian T. Lynch, MSW
 It is Father's Day and I am haunted by story I hear about earlier this week. Over 70,000 children a year are coming across the US border from places like Guatemala, Honduras, El Salvador and Mexico, many of whom are unaccompanied minors. The United States is forced to house these children in temporary detention facilities under very difficult conditions. The situation is desperate as federal agencies and facilities designed to house adults races to accommodate the special needs of young children.
On All In with Chris Hayes, José Diaz Balart reported about the humanitarian crisis at the US Mexican border. Unaccompanied minors are crossing the border in record numbers, sometimes as many as 300 a day. Some of these children are as young as 18 months old. But also, there are couples trying to cross the border with their children who are being met by members of Mexico's drug cartel that take one of the parents hostages for ransom, allowing the other parent and children to cross into the States.
Balart also reported on the conditions that are creating these developments. One Guatemalan mother told him gang violence in her country is so bad that when their daughters reach puberty, gang members will come in and either rape them, kill them, or take them as their property. These parents feel they have no option but to send their children across the border to safety. When US officials try to interview young children to learn who their parents are it is not unusual for 4 and 5 years to not know their parents names or the name of the towns in which they lived. In some cases, trying to reunite children with their families is impossible.

While we flounder around once again in Iraq and other foreign lands with oil resources of interest, we are ignoring the deteriorating humanitarian situations in our own hemisphere. The immigration issues we face are usually couched in protectionist language when the root of the problem is really about promoting growth and stability in foreign countries much closer to home.
We need to direct more resources and attention on foreign aid and international diplomacy among our Latin American neighbors. The social and economic conditions in these countries have reach a crisis proportions. Our immigration problem is a massive refugee problem that our politics and the media isn't addressing. The answers to real immigration reform fall well beyond the scope of our current political dialogue.
It is Father's Day and I am haunted by story I hear about earlier this week. Over 70,000 children a year are coming across the US border from places like Guatemala, Honduras, El Salvador and Mexico, many of whom are unaccompanied minors. The United States is forced to house these children in temporary detention facilities under very difficult conditions. The situation is desperate as federal agencies and facilities designed to house adults races to accommodate the special needs of young children.On All In with Chris Hayes, José Diaz Balart reported about the humanitarian crisis at the US Mexican border. Unaccompanied minors are crossing the border in record numbers, sometimes as many as 300 a day. Some of these children are as young as 18 months old. But also, there are couples trying to cross the border with their children who are being met by members of Mexico's drug cartel that take one of the parents hostages for ransom, allowing the other parent and children to cross into the States.
Balart also reported on the conditions that are creating these developments. One Guatemalan mother told him gang violence in her country is so bad that when their daughters reach puberty, gang members will come in and either rape them, kill them, or take them as their property. These parents feel they have no option but to send their children across the border to safety. When US officials try to interview young children to learn who their parents are it is not unusual for 4 and 5 years to not know their parents names or the name of the towns in which they lived. In some cases, trying to reunite children with their families is impossible.
While we flounder around once again in Iraq and other foreign lands with oil resources of interest, we are ignoring the deteriorating humanitarian situations in our own hemisphere. The immigration issues we face are usually couched in protectionist language when the root of the problem is really about promoting growth and stability in foreign countries much closer to home.
We need to direct more resources and attention on foreign aid and international diplomacy among our Latin American neighbors. The social and economic conditions in these countries have reach a crisis proportions. Our immigration problem is a massive refugee problem that our politics and the media isn't addressing. The answers to real immigration reform fall well beyond the scope of our current political dialogue.
Wednesday, June 11, 2014
De-Cantoring Big Business
by
Brian T. Lynch, MSW

The beltway seems baffled by this, but the trend has been clear for some time. Putting people first in politics will be key to winning over the real voter base of both parties going forward. And peeling off small business owners by promoting specific policies that support them and level their playing field against corporate abuses is an essential element for Democrats. Democrats should be the champions of small community business leaders and ordinary citizens. They should resist the growing corporate influence over government and our lives (without being overtly hostile).
Campaign funding should also be as populist and grass roots as possible, or at least have that as a prominent feature. People should be able to contribute small donations to their candidate's campaign on line using their pay pal accounts, or they should be able to text a contribution on their smart phone. This not only sets the right tone, it takes action against the influence of big money in politics even if particular campaign must still rely on big donors.. But note that in this race Eric Cantor outspent Brat by more than 20 to 1 ratio. The strength of Brats message overcame this huge spending advantage.
As I tweeted earlier today in reference to Cantor, in drawing democrat-proof districts the GOP created congressional district that are toxic to traditional conservative Republicans as well. And traditional conservative Republicans are virtually all big business Republicans. So there is a clear message here for all Democratic candidates. Stop cozening up with corporations and start representing real people.
If Democrats messaging can thread this needle they may be able to pick up disaffected moderate Republican votes while making it harder for radical right-wing Republican's to vote for GOP supporters of ever more crony capitalism.
Here is a snip of the Nation's article by John Nicols:
from The Nation
Breaking news and analysis of politics, the economy and
activism.
http://www.thenation.com/blog/180189/eric-cantor-defeated-conservative-who-rips-crony-capitalism#
The DC-insider storyline
about this being a great year for the Republican establishment is undergoing a rapid
rewrite. For the first time since the post was
formally established in 1899, a House majority leader has been defeated in a
bid for renomination. And as political prognosticators, Republican stalwarts
and savvy Democrats search for explanations, they are being forced to
consider complexities they had not previously entertained -- including the
prospect of conservatives who are ready and willing to criticize big business.
Eric Cantor, the face of
the GOP establishment, one of the party's most prodigious fundraisers and the
odds-on favorite to become the next speaker of the House, lost his Virginia Republican
primary Tuesday to a challenger who promised, “I will fight to end crony capitalist programs that
benefit the rich and powerful.”
Dave Brat,
who defeated the number-two Republican in the House by a 56-44 margin, tore into big business almost as frequently as
he did the incumbent. “I am running against Cantor because he does not
represent the citizens of the 7th District, but rather large corporations
seeking insider deals, crony bailouts and a constant supply of low-wage
workers,” declared the challenger.
Image credit:
Image credit:
Friday, June 6, 2014
FUKUSHIMA - An Annotated list of Articles on this Blog
Someone recently asked if I have been following the crisis at Fukushima. I decided to send them some of my blog postings. It wasn't until then I realized how many there were. I am posting them here for anyone who hasn't been following the story that much, and would like to catch up. They are in no particular order.
- The nuclear accident at Fukushima in Japan last year was a 'man-made disaster' and not completely caused by the devastating tsunami, a new report has said. The Japanese parliamentary panel today submitted its final report. http://aseyeseesit.blogspot.com/2012/07/fukushima-disaster-was-man-made-says.html
FUKUSHIMA - An Unstopable Slow Motion Disaster- The image below is the most
recent Fukushima radioactivity distribution map of the Pacific ocean. It speaks
for itself of the scale of this disaster. Why isn't this more in the news? What
is our government doing for us? http://aseyeseesit.blogspot.com/2013/09/fukushima-unstopable-slow-motion.html
Fukushima Radiation Hits the Beach in California - It would appear that radiation from Fukushima has reached the
California coast and is beginning to build up in the riparian zone on San
Francisco beaches. Here is a You Tube video someone made and posted in December:
http://aseyeseesit.blogspot.com/2013/12/fukushima-radiation-hits-beach-in.html
Media Silent on Fukushima Radiation Impact in US - Sometimes the big news stories can only be seen by the shadows
they cast. You would think that it would be easy to find detailed updates on
the Fukushima disaster's impact on the fishing industry, milk production, etc.
http://aseyeseesit.blogspot.com/2013/01/media-silent-on-fukushima-radiation.html
Data
Driven View Points: Fukushima, A Crisis Still Unfolding - What follows is a report on Fukushima that is chilling. Wm
Boardman published this over at OpEdNews. A portion of it is posted here for
those following this blog and those trying to find follow-up news on what is
happening. http://aseyeseesit.blogspot.com/2013/07/fukushima-crisis-still-unfolding.html
Fish
Near Fukushima Just As Contaminated as Last Year - Fukushima fish still contaminated, new study
says. The data presented in this week's Science journal found that Fukushima
fish are still radioactive from last year's nuclear disaster. Sarah Wolfe, October,
25, 2012. http://aseyeseesit.blogspot.com/2012/10/fish-near-fukushima-just-as.html
Fukushima Disaster May Not Be Over - Japan's former Ambassador to Switzerland, Mr. Mitsuhei Murata,
was invited to speak at the Public Hearing of the Budgetary Committee of the
House of Councilors on March 22, 2012, on the Fukushima nuclear power plant.
http://aseyeseesit.blogspot.com/2012/04/fukushima-disaster-may-not-be-over-yet.
Radioactive Seawater Cross the Pacific from Fukushima - As hair falls out of a Fukushima victim's
head, a new German study reports that North America's West Coast will be the
area most contaminated by Fukushima cesium of all regions in Pacific in 10
years, an "order-of-magnitude... http://aseyeseesit.blogspot.com/2012/08/radioactive-seawater-cross-pacific-from.html
- The nuclear accident at Fukushima in Japan last year was a 'man-made disaster' and not completely caused by the devastating tsunami, a new report has said. The Japanese parliamentary panel today submitted its final report. http://aseyeseesit.blogspot.com/2012/07/fukushima-disaster-was-man-made-says.html
Tuesday, May 27, 2014
Our Chronic Wage Stagnation, Symptoms and Treatments
Decades of frozen wages relative to our expanding wealth is the root cause of many economic problems. More people falling into poverty, a shrinking middle class, declining retirement savings, increased welfare spending, higher unemployment, more aid to working families, declining government tax revenues, diminished funding for Social Security and Medicare, a sluggish economy (despite a record high stock market), slow job growth and heighten social tensions along the traditional fault lines of race, ethnicity and gender are among the many issues influenced by decades of wage stagnation.
Beginning in the late1970's most American workers received only cost of living adjustments in their paychecks while their real earnings gradually diminished each year. Employers increased hourly wages to keep pace with inflation, but they suddenly stopped raising wages to reward workers for their productivity. Earned income has declined for most Americans as a percentage of our gross domestic product (GDP) This amounts to a dramatic and intentional redistribution of new wealth over the last 40 years. Nearly all this new wealth has gone to the rich and powerful.
The visual evidence of wage stagnation relative to hourly GDP is apparent in one powerful graph (below). You may have this it before.

SYMPTOMS
The effects of wage stagnation on our economy have been gradual and cumulative. Its impacts don't raise red flags from one year to the next, but the cumulative effects are obvious. The trending rise in income inequality, for example, was missed entirely for 25 years, and then it still took another decade for it to catch the public's attention.
According to USDA data on the real historical GDP and growth rates[i], the U.S. economy grew by $368 trillion between 1976 and 2013. That is a 109.4% rise in national wealth, more than a doubling of the national economy. Almost none of that wealth was shared with wage earners. If hourly wages continued to grow in proportion to hourly GDP, as it had for decades prior to the mid-70's, the current median family income today would be close to $100,000 a year instead of the current $51,017 per year.[ii]
Think about that for a moment, and about all the implications for wage based taxes and payroll deductions. For simplicity sake, let's say wages would have double if the workforce received productivity raises. That would significantly reduce the number of families currently eligible for taxpayer subsidies such as SNAP (food stamps), housing assistance, daycare and the like. At the same time the workforce would be generating much more income tax revenue.
Consider next the impact wage stagnation has had on payroll deductions. Social Security and Medicare premiums have not financially benefited from the growing economy. Double current wages and you double current revenues for these programs as well. Moreover, the economy has grown at an annual rate of 2.9% since 1976. If Social Security and Medicare had benefited from this new annual wealth, the effect on current revenue projections would be profound. We would not be looking at a projected shortfall any time in the future.
The impact of wage stagnation on consumer spending is perhaps the most insidious problem. While worker wages have stagnated, the production of goods and services has grown. How is that possible? Some of this production is sold in foreign markets, but domestic markets are still primary. And it is here where economic theories have done a disservice.
A generation of economists and business leaders have treated consumers and workers as if they were not one and the same. This has fractured how we look at the economy and given rise to the notion that labor is just another business commodity. It disguises the fact that labors wages fuel consumer spending. Wages help drive the whole economy while wage stagnation reduces consumption over time.
To overcome this effect we have seen the need for mother's to enter the workforce in mass, and for banks to invent credit cards to bolster consumer spending. These and other creative measures can no longer forestall the decline in worker spending. So while the financial markets ride the tide of America's growing wealth, the fortunes of those who have been cut off from that new wealth continue to slip beneath the waves.
As for social tensions among different racial, ethnic and gender groups, the effect of stagnant wages relative to the nation's growing wealth creates a lifeboat mentality and zero sum thinking. For the first time in many generations parents are worried that their children will have less in life than they had. When the whole pie is shrinking a bigger slice by one person means a smaller piece for others. This thinking exists because for over 95% of wage earners the economic pie hasn't grown in 40 years.
TREATMENTS
You may not be ready to accept chronic wage stagnation as "the syndrome" underlying our economic woes, but it's also true from my experience that having solutions (or "treatment options") at hand often makes it easier to identifying the problems they resolve. With that in mind, I want to offer some solutions to America's low wage conundrum.
One direct approach to raising worker wages is the one currently being discussed in the public dialogue, raising the minimum wage. This benefits the lowest paid workers and also puts pressure on employers to increase pay for other lower wage earners. The current target of $10.10 per hour would still leave many families at or below the poverty line. Workers making the new minimum wage would still be eligible for some public assistance for the working poor. While passing a minimum wage law is at least possible, this option is not a systemic solution to wage stagnation. Even index the minimum wage to inflation would not compensate for declining wages relative to GDP growth.
Another direct approach to ending wage stagnation is to pass a living wage law. This would set the minimum wage at a level that would allow everyone working full-time to be financial independent from government assistance, including subsidized health care. A living wage law could be indexed to the local cost of living where a person is employed. This is idea because it takes into account local economic conditions which are determined by market forces rather than government edict. But passing a living wage law in the current political climate is unlikely.
There are other ways of encouraging wage growth that don't involve direct wage regulation. One idea would require the federal government to recoup, through business income tax rebates, the cost of taxpayer supported aid to working families from profitable businesses that pay employees less than a living wage. Employee wages are easily identified through individual tax returns. Eligibility for taxpayer supported subsidies are relatively easy to estimate as well, so recouping public funding to support a company's workforce is a practical possibility. A portion of the recovered money could be paid into Social Security and Medicare to make up for lost revenue due to substandard wages.
A welfare cost recovery plan could gain popular support given the growing public resentment towards taxpayer funded social programs. At least 40% of all full-time employees in America currently require some form of taxpayer assistance to financially survive. More importantly, this plan places the burden of supporting the workforce back on profitable businesses where the responsibility lies.
Another solution has been suggested by former US Labor Secretary, Robert Reich, and others. They support proposed legislation, SB 1372, that sets corporate taxes according to the ratio of CEO pay to the pay of the company's typical worker. Corporations with low pay ratios get a tax break. Those with high ratios get a tax increase. This would effectively index worker wages to CEO compensation in a carrot and stick approach to corporate taxes. The details and merits of this approach is outlined elsewhere.[iii]
Do U.S. businesses have the financial capacity to offer higher wages to their workers? I would like to answer that question with another graph that you may also have seen before.

Credit: Blue Point Trading http://www.blue-point-trading.com/blue-point-trading-market-view-june-07-2012
There is a clock ticking somewhere in the background on this issue. There is a point somewhere in the future where it will be too late to fix wage stagnation through the normal democratic processes. History has proven this to be true. We are not at that point now, but we are past the point treating wage stagnation earnestly.
Subscribe to:
Posts (Atom)
Counter
