Friday, May 22, 2015

Cycle of Death for the American Republic

by Brian T. Lynch, MSW


Any questions?

This has been business as usual in the cycle of America elections. We have spiraled into moral bankruptcy and lost the ability of government to meet the basic needs of the electorate. We have made a mockery of self-rule. In issue after issue, huge majorities favoring or opposing government policies are ignored by the representatives they elected. The cycle of ever growing special interest government is why states and the federal government have no money to spend on roads, schools, healthcare daycare, parks, public projects, etc.  Here is how this cycle operates:

  • Establishment politicians need massive media buys to get elected, 
  • The corporate media is rapacious in what they charge for political ads and in manipulating candidates to pay for it, 
  • The ever wealthier donors are the only ones with that kind of money to give to candidates, 
  • The big donors extract favors and tax breaks that further tilt the playing field in their favor which further depletes the public coffers, 
  • Paying for these favors and for collecting less in taxes forces governments to cut programs and services that help the poor and middle class, 
  • The failure of politicians to meet the needs and wishes of voters breeds cynicism and contempt for government causing more and more people to turn their backs on politics and elections, 
  • The twin pressures of declining wages and declining government services heightens competition between segments of society and creates divisions and social tensions which unscrupulous politicians exploit. 

  • The combination of disengaged voters and dwindling income in the middle class reduces the size of political contributions from ordinary citizens. 
  • The result is even more reliance on big donations for political campaigns.


Thursday, April 23, 2015

Un-Taxing the Rich is the Root Cause of the Public Pension Crisis

by Brian T. Lynch, MSW

What follows is a letter I wrote to New Jersey's principal newspaper, which is constantly trying to convince us that the huge pension deficits created by bad public policy decisions (or perhaps by intentional public union busting strategies) can't be fixed without dismantling the whole system and starting over. All options to do this create great sacrifices by hard working servants of the people who were promised pensions in exchange for lower lifetime wages than the private sector would be paid for comparable work.

What makes this relevant beyond New Jersey's boarders is that public employee pension systems are under similar financial assaults in nearly every state. It is a pattern so powerful that it has to be part of a bigger plan.


Dear editor:

"Taxing the rich won't solve pension problems" claims the Star-Ledger in its editorial. Their point is that the "millionaire's tax" vetoed by Gov. Christie wouldn't plug the current pension gap.

This is true, but the larger point is that the "un-taxing" of the rich and the wealthiest companies in New Jersey is the real reason we have a crisis. Stack up all the tax money not collected due to corporate tax breaks and tax cuts given away since the Whitman administration until now and it would tower over the cash it would have taken to pay pension obligations from the beginning.

Money is fungible. Whenever tax revenue is deleted from the budget, someone's ox has to be gored. For decades that ox belonged to State employees. Their pensions is part their wage package and the reason their overall compensation is roughly parallel with the private sector. Not funding it was a deliberate choice.

Another fact hidden in plain view is that revenue deleted from the budget doesn't have a line item to remind us of what's missing. We end up blindly subsidizing profitable corporations instead of properly compensating ordinary folks who work for us.

It's disingenuous for politicians (or the Star-Ledger) to speak of pension reform without also discussing the massive tax breaks that created this crisis. If tax cuts for businesses and people who don't need it were rescinded, there would be plenty of revenue to fund the pensions.


BLOG NOTE: If this is happening in your state, or if you are from New Jersey and want to do something about the pension mess, feel free to use this as a template for your own letter to the editor or to your representatives in government. 

Sunday, April 19, 2015

New Data Exposes Racial Bias in Fatal Police Encounters Nationwide

by Brian T. Lynch, MSW

Michael Brown was killed on the streets of Ferguson, Missouri, touching off community riots. Michael was African-American. The officer who shot him was white. Frustrations and local suspicions of racially biased policing, since then confirmed by a federal investigation, was simmering in that community for years. There have been other recent cases in the national news. There was the murder of Walter Scott of North Charleston, South Carolina, the sad shooting death of 12-year-old Tamir E. Rice of Cleveland, Ohio, and the chokehold death of Eric Garner in New York, to name just a few.

These shocking cases have focused national attention on what seems like a rash of questionable police killings involving minority citizens. Until now there has been no way of telling if the perception of police bias is due to media bias, statistical flukes, or real patterns of differential policing in minority neighborhoods. A big question hanging in the air:

Is the use of deadly force disproportionately used in Black or Latino communities?

I will answer that question below using newly gathered data. The question can't be answered by standard government statistics. There is no mandatory or systematic reporting of police killings in America. With 17,000 law enforcement agencies acting mostly on their own, fatal encounters are seldom noticed beyond local news accounts, the bulk of these relying on local police statements. There is no public notification requirement when people are killed by police.

That's why it is a big deal that several citizens have begun scanning the internet for local news accounts of police action fatalities and compiling a listing of them on their KilledByPolice.com Website. Shocking preliminary findings showed that in just 23 months of record keeping 2,181 people were killed in police encounters. For some perspective, there were only 70 police killings in the past 90 years in Great Britain.

This analysis only looks at three demographic categories, White (non-Hispanic), Latino, and Black. All other demographic categories are excluded because they are still too few in number for a meaningful analysis. The population totals and fatality data used here are only for these three study groups.  This is not to diminish the importance of other demographic groups, especially in the fatality data, but that analysis will have to wait until more data is available. Also, local news accounts often do not report the race, ethnicity, or even the identity of the person killed. This forces us to assume unreported demographic information, if known, would reflect the population as a whole rather than the fatality patterns observed below. This data includes all cases where a civilian is killed in a police action whether accidental, justified, or unjustified.

Below are four comparative bar graphs for each of the US Census regions of the United States. It compares the distribution of the total White, Latino, and Black population in the region with the distribution of people killed in police encounters within the region. 


 If police action fatalities were random events then the demographic makeup of people killed should reflect the population. The four regional graphs above almost speak for themselves. In every region of the country, Blacks comprise a significantly larger portion of those killed in police encounters than expected based on regional demographics.  You will notice that Latino populations are also over-represented among police action fatalities in the West.  I will discuss results in each region below and show some of the state data that may be significant in understanding these findings.

THE NORTHEAST

In the past 23 months, there was a disproportionate number of police-involved killings in the African-American community in the Northeast Region. There were 197 instances where people were killed in their encounters with police. This is the lowest number in any region, but this is also the region with the smallest population (for these three racial/ethnic categories). In 150 of these cases, the ethnicity or race of the person killed was reported in the press. Blacks make up 13% of the population in the Northeast and 37% of police action fatalities. This is an unrepresentative finding. The numbers for Latinos killed by police actions were slightly under-represented. They represent 13% of the study population and 11% of those killed by police. Because the Northeast has fewer police action fatalities several states have fatality numbers too low for meaningful analysis. The three exceptions are New York, New Jersey, and Pennsylvania.

New Jersey had more Black citizens killed by police than White citizens in the past 23 months. There were 31 police action fatalities, 25 of which where race or ethnicity was reported. Blacks make up 15% of New Jersey's population but 52% of police action fatalities in this data. Twenty-five cases are really too confirm a finding, but the trend is startling.

In Pennsylvania and New York, there were higher numbers of fatalities than in New Jersey and evidence that these were also disproportionately Black lives,


Pennsylvania had 52 police action fatalities, 14 where race/ethnicity was not reported, and 38 others.  Blacks make up 11% of the three racial-ethnic groups in this study and 34% of those killed in police actions. Latinos are 6% of this population and 8% of the fatalities.

New York had 56 incidents, 14 where the race wasn't reported and 42 others. Blacks comprise 17% of the study population and 43% of those killed in police actions. Latinos represent 19% of the study population and 9% of the casualties in police actions in the past 23 months.

The number of fatalities in Massachusetts was also disproportionately black, especially relative to the population, but the total number of police action fatalities was too small to be sure of the significance. Massachusetts had 26 police action fatalities of which race was not reported in 7 and 19 others where it was reported.


In the remaining states of Connecticut, Maine, New Hampshire, Rhode Island, and Vermont the total number of people killed by police was 32 with 6 cases where the race was not identified. Of the other 26 cases, 18 were White, 4 Latino, and 4 Black.


THE MIDWEST

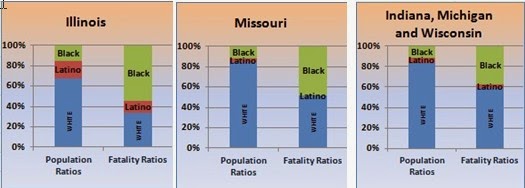
In the past 23 months, there were 339 instances where people were killed in their encounters with police. In 255 of these cases, the ethnicity or race of the person killed was reported. Blacks and Latinos each make up 13% of the study population but Black citizens made up 40% of all those killed in the Midwest during police encounters. Latinos were less likely to be killed in police actions. They were just 5% of the casualties. The states that had the most fatalities and largest disparities in the region were Ohio, Illinois, and Missouri.


Ohio's study population here is 13% Black yet 55% of those killed in police actions were Black. No Latinos were reported killed. There were a total of 61 cases where citizens were killed by police actions. The race was not reported in 10 of those cases.


Illinois had 63 citizens killed in police actions. No race or ethnicity was reported in 37% of those cases. Blacks are 15% of the study population but 55% of the police action fatalities. Latinos fared better, being 17% of the population and 12% of the casualties.

In Missouri, there were 49 citizens killed in police actions of which race was reported in 37 incidents. Blacks make up 12% of the study population and 49% of the police action fatalities.

In Wisconsin, Michigan, and Indiana the rate of Black fatalities in police encounters was also higher than expected, but the number of individual cases was too few for individual analysis. The numbers for these three states were combined. The result yielded 87 cases, 61 of which where the race was reported. Of those 61 cases 36 casualties were White, 2 Latino, and 23 Black. Blacks make up 11% of the population in this combined group and 38% of the fatalities in police encounters.


In the remaining states of Iowa, Kansas, Minnesota, Nebraska, North Dakota, and South Dakota the combined total of people killed in police actions was 46 with race not reported in 15 cases. No minorities were killed in North Dakota or South Dakota. Blacks and Latinos were 15% and 11% of the total casualties and Whites were 74% of the total.


THE SOUTH

The Southern Region is the most populated of the four regions. There are many states with over 30 incidents in 23 months, partly because of higher populations. There were 890 cases where people were killed in their encounters with police. In 652 of these cases, the ethnicity or race of the person killed was reported. The Southern Region has the highest population, the highest number of police action fatalities, and the highest percentage of African-Americans in the population. Blacks make up 20% of the population and Latinos another 17%. White, non-Hispanics are 63% of the total population. Black casualties of police actions made up 40% of the total cases in the prior 23 months. Latinos had 13% of the police action fatalities.

Alabama had 31 police action fatalities in 23 months where the race was identified. Blacks represent 27% of the study population and 55% of the casualties. There were 8 additional cases where the race of the victim was not identified. No Latino fatalities were identified.

In Florida, there were 140 police action fatalities with a very significant 35 cases in which race or ethnicity was not identified. Blacks make up 17% of the study population and 38% of the casualties while Latinos are 23% of the population but only 13% of the casualties.

Georgia had 42 cases with 18 additional cases were the identity of the casualties were not provided. Blacks make up 32% of the state and 55% of the police action fatalities. Latinos make up 9% of the study population and just 2% of the casualties.

Louisiana had 27 police action fatalities where race the race of the casualties were known and 13 where this information wasn't initially reported. Blacks are 33% of the population and 595 of the casualties. Latinos were evenly represented at 4% of both the study population and the casualties.

Maryland had 31 cases in 23 three months plus an additional 12 where the race was not identified. Blacks make up 23% of the population but 68% of the police action fatalities. The highest ratio in the nation. Latinos represent 9% of the study population and 6% of the casualties.


North Carolina had 48 cases and 11 more where the racial or ethnic identity was not reported. Blacks make up 22% of the state and 55% of the police action fatalities. Latinos are 9% of the state and 4% of the casualties.

Oklahoma, with the smallest population in the South, had 45 police action fatalities where the race was identified and another 12 where it wasn't. Just 9% of the population is Black and they represented 38% of the fatalities. Latinos make up 10% of the population and 18% of the police action fatalities.

Tennessee had 31 incidents and 9 more cases where the racial identity was undisclosed. The state is 17% Black and Blacks made up 29% of the fatalities. Latinos are 5% of the population but 0% of the fatalities.

Texas has a large population and there were 153 police action fatalities where ethnicity or race of the casualties was identified. There were 51 other cases where this information was not reported in the local press. That is the highest number in this category. Blacks are 12% of the population and 25% of the police action fatalities. Latinos are 40% of the study population but only 37% of the casualties. The high number of cases where race or ethnicity was reported could substantially change these percentages.


West Virginia is note worth for having no minority police action fatalities. There were only 13 cases with 5 White casualties identified. The state is mostly White.


THE WEST

Turning attention to the West, there were 697 people killed in police encounters in the past 23 months. Of those, the race of those killed by police was reported in 491 cases. In this Region, Blacks make up 6% of the study population and 14% of the police action fatalities. This is the lowest percentage of Black casualties in absolute terms but still over twice what it should be by chance alone. The Western region, on the other hand, has the highest percentage of Latinos in the four regions. It is also the only region where Latinos have a higher rate of police action fatalities than chance would allow. Latinos comprise 33% of the population and 38% of people killed in fatal police encounters.

Arizona had 94 police action fatalities in the past 23 months and the race of the person killed was released in 67 cases. Blacks comprise 5% of the population under study here and 9% of the casualties. Latino fatalities were more disproportional. They make up 32% of the population and 42% of the people killed in police encounters.

California had the most civilian fatalities in police encounters in the country and is also the most populated state. It had 351 police action fatalities of which the race of the casualties was reported in 251 cases. Blacks represent 7% of the population and 20% of the police action fatalities. Latinos are 45% of the population and 47% of the casualties.

Colorado had 43 police action fatalities of which 16 cases provided no information on the race. Blacks are 4% of the population and 7% of the casualties in a police encounter. This is among the most representative of Black demographics for any state among high population states. On the other hand, Latinos comprise 22% of the population and 45% of the police action fatalities. This is the most disproportional rate for this group nationwide.

Nevada had 32 people killed in police encounters of which race was not reported in 12 (38%) of the cases. Blacks comprise 9% of the population and 15% of the casualties in fatal police encounters, while Latinos represent 30% of the study population here but 15% of the fatalities.


New Mexico had only 28 fatality incidents and just 3 cases where the race of the casualties was unreported. Blacks comprise 2% of the study population and 8% of those killed in police encounters. Latinos are 52% of the population and 48% of the civilian casualties.

Oregon had 29 fatal police encounters, 19 in which the race of the people killed was reported. Blacks are 2% of the study population and 5% of the casualties. Latinos make up 13% of the population and 11% of those killed in police encounters.

Utah had 25 police action fatalities, 23 in which race was identified. Blacks account for about 1% of the study population and 9% of the fatalities in police encounters. Latinos are 14% of the study population and 13% of the total, which is essentially a representative proportion.

In Washington State, there were 58 cases where civilians were killed in police encounters. In 23 cases (43%) the race of the persons killed was not reported. Blacks comprise 4% of the study population and 11% of the fatalities. Latinos represent 13% of the population and 17% of the fatalities.


Wyoming had only 4 police action fatalities and all of the casualties were White.


Discussion

If my hypothesis is to disprove that African Americans are more likely to be the casualties in fatal encounters with law enforcement (the null hypothesis), then this journalistic analysis failed to prove it.

It might still be true that there is nothing to the perception that Black Americans are more likely to die in police encounters, but the evidence here strongly suggests the contrary, they are a disproportionate class of people killed in police encounters in virtually every region of the country. It can be said that this isn't true in every state, but that is of little comfort to minority communities.

This review of this newly collected data supports the suspicions that minority communities may be subject to differential police tactics or over-policing.  The depth and breadth of these finds are disturbing. Blacks are simply more likely to be killed in police encounters in every area of the country and a majority of the state. Latinos are also more likely to be among the fatalities in the West. Fatalities in these police encounters are also overwhelmingly men. The gender basis of these findings have yet to be studied or even noticed, One might be tempted to think this higher rate of Black men being killed in police encounters is connected to so many young Black men being unemployed and on the streets, yet the average age of those killed by police is 36.9 years. This is almost exactly the average age in the U.S. population. This means there is no statistical bias due age which rules out a young black male theory.

Another factor some folks bring up is the high crime statistics in minority neighborhoods and a greater chance that minority folks act like criminals. First of all, there are very few crimes that carry a death sentence, which is was is administered by law enforcement where there are safer ways to apprehend a suspect. And crime statistics are mostly sensitive measures of policing policies, tactics, training, law enforcement priorities, and the culture or attitudes of those doing the policing. If you target any given group to enforce laws their crime statistics will climb. A secondary result of economic disparity and heavy-handed policing is the contempt for the law that is often seen in poor and minority neighborhoods. The latter follows as a consequence of the former in nearly all cases.

As for minority folks acting like criminals, who is making that judgment, and what is the evidence?
 I have reviewed dozens of specific recent cases at this point and can say that some of these police action fatalities are completely justified but in most cases, there aren't enough detail to form any judgments. There are also many cases where it seems law enforcement had other options to avoid the use of deadly force.  Very few cases involve independent investigations of the incident or judicial reviews. They rely on mostly local police accounts with no eyewitnesses or video cameras. The police are policing themselves.

To the best of my knowledge, this is the first look at what is probably the most comprehensive collection of information about police action fatalities. This is more a journalist exercise than a scholarly study and this information badly needs a more scholarly treatment. Still, I believe the original question asked here can be tentatively answered in the affirmative:

The use of deadly force is disproportionately used in the Black community in every region of the country and in the Latino community in the West.


__________________________

Related Stories on this Blog

Three People Die in Police Custody Every Day
http://aseyeseesit.blogspot.com/2015/04/three-people-die-daily-in-police-actions.html

Police Action Fatalities in America
http://aseyeseesit.blogspot.com/2015/04/police-action-fatalities-in-america.html

Police Homicides, What We Know and Don't Know
http://aseyeseesit.blogspot.com/2014/09/police-homicides-what-we-know-and-dont.html

Serve and Protect or Enforce and Collect, The Changing Character of Local Police
http://aseyeseesit.blogspot.com/2014/06/serve-and-protect-or-enforce-and.html

Police Killings Not Uncommon, Exact Numbers Are Unknown
http://aseyeseesit.blogspot.com/2014/08/police-killings-not-uncommon-exact.html

Consequences of Militarized Police Departments in America
http://aseyeseesit.blogspot.com/2012/05/consequences-of-militarized-police.html

Stop-and-Frisk and Racial Profiling, What We Should Know

http://aseyeseesit.blogspot.com/2012/06/stop-and-frisk-and-racial-profiling.html


Saturday, April 11, 2015

Police Action Fatalities in America

by Brian T. Lynch, MSW

On April 4, 2015, Walter Scott, an African-American resident of South Carolina, was stopped for having a broken tail light. He was stopped by Officer Michael Slager, a White, North Charleston police officer. A few minutes later Scott was dead. He was shot several times in the back while trying to flee after being tasered. The incident was presented as a justifiable use of force by authorities until a videotape surfaced showing Officer Slager calmly raising his service weapon and firing into the back of Mr. Scott as he was running away. Slager was subsequently fired from the force and charged with first-degree murder. It was national news.

Stories of people killed by local police action rarely get national attention. Unless there is some dramatic twist or shocking video, the incidents are only reported in  hyper-local community newspapers. The only sources for these reports are usually a police spokespersons and sometimes friends or grieving family members. When cases like the Scott shooting capture regional or national attention they also raise significant, unanswered questions. Just how many citizens are killed in police actions in this country? Is this rare? Who is keeping track of the numbers? Does this sort of thing happen in mostly in certain areas or departments? Is it just a few bad apples or are there larger patterns?

There are no national databases to track police involved civilian deaths. The FBI maintains a partial database of "justified police homicides," but reporting by state and local authorities is voluntary. Only 750 of the more than 17,000 law enforcement agencies in this country submit their data. This limited reporting yields about 400 police homicides per year,

Almost two years ago a group of dedicated citizens began searching through local newspaper accounts of police involved civilian deaths throughout the country. They started a Website called KilledByPolice.net where they compile names of civilian casualties and links to the initial news accounts.  They also open a Facebook page on each person killed to post any follow-up news stories and to collect any local comments about these fatalities. Most of these fatalities are police homicides, justified or otherwise, but the data also included murder/suicides by police officers, tatal DWI accident where the officers were intoxicated, police assisted suicides of mentally ill persons and other such categories. This effort turns out to be the most comprehensive data resource I've seen so far on police action fatalities. Based on this raw material I have begun my own analysis of the data.

Here is a brief summary of my initial findings to date.

Between May 1, 2013 and April 4th, 2015 there were 2,181 civilians killed by police officers in the United States. That works out to around 95 per month or 3 police action fatalities per day. There is clearly a gender bias in police action fatalities. Almost all are males, 2,044, with only 135 females killed in the 23 month period. In six other case the gender was undisclosed.

The identities of 565 fatality victims were not disclosed to the media as of now. The average age of the known fatality victims is 36.9 years, which is also the national median age of the population. This means that there is no age bias in police action fatality. Latino's make up 18.7% of the general population and were 17% of the fatality victims during the past 23 months, suggesting their rate of police involved fatalities is proportional on a national scale. Whites make up 77% of the population but only 48.1% of the victims. African-Americans make up just 13.2% of the general population but 30.5% of the total fatalities. This clearly suggests a racial bias in police action fatalities.

When the data was sorted by U.S. Census regions, 41.5% of all police action fatalities took place in the Southern states. Add California's 730 incidents to the Southern total and the figures account for 58.4% of all cases nationwide. In contrast, police action fatalities in the highly populated Northeast make up 9% of the total. (see pie chart) The large regional differences strongly suggests that these incidents are not the random acts of a few bad apples but real differences in police training, policy and culture.

 The states with the highest rate of police action fatalities, in descending order, are Alabama, Wisconsin, Washington State, Arizona, Oklahoma and New Mexico. Wyoming, Vermont and Idaho have the lowest rates. The states with the highest annual average of civilian fatalities are California (193), Texas (112), Florida (93), Arizona (50) and Illinois (33).

The data contained in the KilledByPolice Website is far more extensive since in contains reports of the police accounts and some follow-up articles, but this information is not yet in a form that allows for statistical analysis. It seems that most of the reports I reviewed so far involve police shootings, but this remains to be verified.

Defenders of law enforcement will say, with some justification, that the vast majority of police officers are honorable, law abiding and competent professionals who put their lives on the line to serve and protect the public. This is a true statement. As a whole the incidents of police action fatalities involves a tiny fraction of the overall mortality rate and it is sure to be a tiny fraction of all incidents of police engagement as well. This, however, is not a high standard to judge whether the current rate of fatal outcomes is significant.  To help put these numbers a national context, there were only 70 civilians killed by the police in Great Britain in the last 90 years.

The better standard to judge the significance of this problem is to ask how many of these civilian casualties could we have avoided. Even when a police shooting is ruled a justifiable homicide, for example, different tactics and better training might still have avoided a fatal confrontation. The justifiable use of deadly force is predicated on existing policies, procedures, tactical training, departmental culture and the careful vetting of law enforcement personnel, to list just a few factors. It is our obligation police action casualties and protect the life and safety of every citizen, including those who are subject of police actions. The problem is very real and it deserves public attention.

----------------------------------------------
Related Stories on this Blog

Three People Die in Police Custody Every Day
http://aseyeseesit.blogspot.com/2015/04/three-people-die-daily-in-police-actions.html

New Data Exposes Racial Bias in Fatal Police Encounters Nationwide
http://aseyeseesit.blogspot.com/2015/04/new-data-exposes-racial-bias-in-fatal.html

Police Homicides, What We Know and Don't Know
http://aseyeseesit.blogspot.com/2014/09/police-homicides-what-we-know-and-dont.html

Serve and Protect or Enforce and Collect, The Changing Character of Local Police
http://aseyeseesit.blogspot.com/2014/06/serve-and-protect-or-enforce-and.html

Police Killings Not Uncommon, Exact Numbers Are Unknown
http://aseyeseesit.blogspot.com/2014/08/police-killings-not-uncommon-exact.html

Consequences of Militarized Police Departments in America
http://aseyeseesit.blogspot.com/2012/05/consequences-of-militarized-police.html

Stop-and-Frisk and Racial Profiling, What We Should Know

http://aseyeseesit.blogspot.com/2012/06/stop-and-frisk-and-racial-profiling.html

Tuesday, April 7, 2015

Three People Die Daily in Police Actions

by Brian T. Lynch, MSW

On April 4, 2015, Walter Scott of South Carolina was stopped by a North Charleston police officer for a broken tail light on his car. It was Saturday morning. Scott had no significant prior criminal history and was unarmed. At some point Scott exited his vehicle and according to the police officer Scott reached for the officer's Taser. The officer drew his weapon and fired multiple shots, killing Walter Scott. The officer said he feared for his life and was justified in using deadly force.

That's the way things stood until three days later when a video tape by an anonymous witness surfaced at the New York Times and other media outlets. The video clearly shows Scott running away and the officer calmly taking aim and firing multiple shots into Scott's back. The officer then handcuffed Scott, ran back to where the office had fired his gun, picked up an object off the ground and then dropping it beside Scott's body. The video was turned over to investigators and Officer Michael Thomas Slager was charged with first-degree murder for the shooting death of Walter Scott. Michael Slager is white. Walter Scott is black. This is a nightmare story that is all too common.

Between May 1, 2013 and April 4th, 2015 there were 2,178 citizens killed by police officers in the United States according to an extensive search of public news accounts. These media accounts include police homicides, justified or otherwise, murder/suicides involving police officers and their family, DWI accidents involving officers under the influence of alcohol or drugs, police assisted suicides of mentally ill persons and other such catagories. A more detailed analysis of this database
is pending and will be published here when completed. But there are a few quick facts off the top that you should know.

In 23 months news accounts reported 2,178 civilian fatality incidents at the hands of the police. That means there are about 94 per month or around 3 police homicides per day. Fatalities are almost entirely men, 2,044, with only 135 woman killed and 6 whose gender was undisclosed. In contrast, there have been only 70 police action fatalities in Great Britain in the last 90 years.

The identities of 565 victims were undisclosed to the media. The average age of the known fatality victims is 36.9 years. Latino's make up 18.7% of the general population and were 17% of the fatality victims during the past 23 months. Whites make up 77% of the population but only 48.1% of the victims. African-Americans make up just 13.2% of the general population but 492 of the victims of police related fatalities, or 30.5% of the total. If there is a perception in the Black community that they are disproportionally targeted by police, these facts only confirm their fears.

The vast majority of law enforcement officers are good, law abiding men and woman who put themselves on the line to protect us. So, it may seem impossible that any officers could wantonly direct deadly force towards otherwise law abiding citizens of color without legal justification. The Scott video is graphic evidence that it does happen. You can see for yourself here, but a warning: video is disturbing.

A full and fair discussion of racism, the law and the American Justice system is overdue. The urgency is now. People are dying.

Related Stories on this Blog

Police Action Fatalities in America
http://aseyeseesit.blogspot.com/2015/04/police-action-fatalities-in-america.html

New Data Exposes Racial Bias in Fatal Police Encounters Nationwide
http://aseyeseesit.blogspot.com/2015/04/new-data-exposes-racial-bias-in-fatal.html

Police Homicides, What We Know and Don't Know
http://aseyeseesit.blogspot.com/2014/09/police-homicides-what-we-know-and-dont.html

Serve and Protect or Enforce and Collect, The Changing Character of Local Police
http://aseyeseesit.blogspot.com/2014/06/serve-and-protect-or-enforce-and.html

Police Killings Not Uncommon, Exact Numbers Are Unknown
http://aseyeseesit.blogspot.com/2014/08/police-killings-not-uncommon-exact.html

Consequences of Militarized Police Departments in America
http://aseyeseesit.blogspot.com/2012/05/consequences-of-militarized-police.html

Stop-and-Frisk and Racial Profiling, What We Should Know

http://aseyeseesit.blogspot.com/2012/06/stop-and-frisk-and-racial-profiling.html

Wednesday, April 1, 2015


Understanding Social Power

by Brian T. Lynch, MSW

Introduction

What does it really mean when we say, "that person is very powerful." Or what is it about an organization or corporation that makes us think of it as being powerful. The word "power" has clear meaning when we are talking about a car motor, or water crashing down a cliff side. Yet when we apply the word to people or organizations it is more difficult to pin point just what we mean. The power we are speaking of is social power, and why a person has it and how it operates often seems mysterious.

My purpose here is to describe in brief my understanding of social power, what it is and how it operates. I have read books and articles on the subject but have not been very satisfied. I found the language of these works to be somewhat inaccessible or ambiguous. Also, the focus is often too narrow for such a broad topic. 

I have no special credentials to bring to this task beyond a lifetime of observation as a social worker in the fields of mental health and child welfare. I consider myself privileged to have observe people on many different levels from the intimacy of their homes to the halls of government power. This discussion, then, is intended more as a personal reflection than a scholarly pursuit and a hopeful effort to raise a productive discourse on this topic.

While each of us understands social power and responds to it in our daily lives, it remains difficult to define. This is partially because it is so pervasive and takes so many forms. It operates on every level of human interactions from the intimate to the geopolitical. For social beings, social power is our atmosphere. It surrounds us like an ocean, is essential for our survival and yet as invisible and ever changing as the wind.

Social power is often expressed in symbols. We all recognize obvious symbols of social power, like an American flag or a corporate logos. We bestow social power on our politicians when we elect them to govern. We ascribe power to people who attain "powerful position" in their company or organization. There are also very clear status symbols of power, such as a police uniform, or a Gucci handbags or the Armani suits worn by successful business people. We recognize social power when we see the skyline of great cities or the grandeur of beautiful cathedrals and synagogues. Social power is often very evident in religion. It is seen in religious symbols of worship. The special attire of priests, ministers or rabbis confer a measure of social power in the form of respect or prestige. The ornate garments of the Catholic pope during a high mass still invoke the power of ancient Roman.

But the absence of power is just as evident. We see it in the beggar or the homeless woman on the street. We sense the absence of power in the ghettos or in the desolation of small, redundant rural towns in far flung places. We sense it in young children or in the elderly living out their lives in a nursing home. We even sense it in our pets.

We all recognize and respond to social power every day. We know there is a certain pecking order in our families, among our friends or among our colleagues at work. We often exercise or respond to social power without giving it much thought. We acquiesce to authority figures such as a parent, a teacher, a rabbi, a boss or a judge. We often accede to the requests of a trusted friend or a loved one and expect the same in return. Conversely, we are very aware of social power when it is imposed on us or we are imposing it on others.

Aware of it or not, in big ways and small, we are constantly exercising or responding to social power. How we experience it goes by many names; respect, duty, obligation, intimidation, pressure, fear, expectation, demand, request. We also experience our own social power as internal feelings. We might feel empowered, entitled, privileged, respected, or even feared. On the other hand, we feel weak, vulnerable, shamed or disempowered when we are ignored, rebuked, humiliated or abused. Suffice it to say, we are a massively social species. We have evolved keen social instincts and most of us develop significant social skills throughout our lifetime.

In future installments I will define social power and trace its many forms over the spectrum of human activity. At every stage, after each post, I hope that you, the reader, will provide your reactions, insights and ideas to help improve this project. No contribution is too small or too grand, so please take the time to comment and share your thoughts and ideas. Thank you.

Thursday, March 26, 2015

Is Obamacare Helping Anyone Stay Healthy?

by Brian T. Lynch, MSW

Let's say you really want to know if Obamacare has had a positive effects on keeping people healthy. Partisan politics makes it difficult to get any concrete or objective answers to this or any questions regarding the Affordable Care Act (ACA). So how would you go about finding the answer?

You could find out by designing your own study. You might start by looking at diseases that are silent killers because these have permanently damaging effects long before there are physical symptoms.

Diabetes is just such a disease. According to medical sources, as many as one person in four have diabetes and don't know it. The longer it goes undetected the more it damages your internal organs, yet a simple blood test and doctors visit is all it takes to uncover and control this disease.

Now imagine that you have results of 400,000 diabetes blood tests nationwide from which you could pull out all the newly diagnosed cases. First you sort the new case in 2013, before any Medicaid expansion, from the 2014 cases after the expansion. Next you sort the new diabetes cases from each period by the 26 states that expanded Medicaid from the 24 states that refused. A concrete measure of an improved healthcare outcome would be finding that there was an increased rate of diabetes detection in the expansion states over the non-expansion states.

Just such a study was done and published this week (March 21, 2015) by Qwest Diagnostics, a national medical laboratory. What their analysis discovered was a 23% increase of newly diagnosed cases of diabetes in the states that expanded Medicaid in 2014. There was only a 0.4% increase in new diabetes cases from states that did not expand Medicaid. What's more, they were able to see a trend towards earlier detection of diabetes in the expansion states. Earlier detection means fewer heart attacks, strokes, kidney transplants, amputations, blindness and premature deaths. This, in turn, means a healthier population and lower health care costs over time.

Thousands of people will now lead healthier lives and live to their full potent in those 26 states that expanded Medicaid under the ACA. The number of people who could have been covered by the expansion roughly equals the number who got coverage in 2014. This means an almost equal number of people will likely experience needlessly declining health due to undiagnosed diabetes. The states that don't expand Medicaid will have higher healthcare costs in the future resulting from a less healthy population.

The news isn't all bleak for the poor or elderly in states that didn't expand Medicaid. A report by the Avalere Health organization recently found that there are 550,000 new enrollees in standard Medicaid in 15 states that have not expanded Medicaid. They attribute this rise in enrollment to the "woodwork effect," caused by increased public awareness and publicity surrounding Obamacare. These are individuals who were eligible for standard Medicaid but hadn't applied. It is safe to presume that some of them will benefit from the early detection of diabetes.

From this one Quest diagnostics study alone the answer is clear. The Affordable Care Act is having a positive effect on the health and well-being of citizens in those states that expanded Medicaid. There are other silent killers that can easily be detected early while treatments and cures are still possible, such as high blood pressure and many types of cancer. If earlier detection of these diseases are also resulting from Medicaid expansion, this would be overwhelming evidence that the ACA is improving health outcomes.

Expanding Medicaid doesn't cost the states any additional revenue for the first few years. After that there is significant reimbursements from the Federal Government. Refusing Medicaid expansion actually costs states millions of dollars in uncompensated care right now. Doing this on ideological grounds is not a principled position, not when it clearly results in a less healthy population and increased medical expenses for the foreseeable future.

I close with a quote from the actual Quest Diagnostics study findings:

Actual Study Findings:

"We identified 215,398 and 218,890 patients who met our definition of newly diagnosed diabetes within the first 6 months of 2013 (control period) and 2014 (study period), respectively (a 1.6% increase). We identified 26,237 Medicaid enrolled patients with new diabetes in the control period vs. 29,673 in the study period: an increase of 13%. The number of Medicaid-enrolled patients with newly identified diabetes increased by 23% (14,625 vs. 18,020 patients) in the 26 states (and District of Columbia) that expanded Medicaid compared with an increase of 0.4% (11,612 vs. 11,653 patients) in the 24 states that did not expand Medicaid during this period. Similar differences were observed in younger and older adults and for both men and women."

--------------------------------------------------------------------------------------------------

Quest Diagnostics Diabetes Study: http://care.diabetesjournals.org/content/early/2015/03/19/dc14-2334.full.pdf+html

Avalere Health Report: http://avalere.com/expertise/managed-care/insights/avalere-analysis-medicaid-non-expansion-states-experience-up-to-10-enrollme

Sunday, March 22, 2015

Lake Hopatcong in New Jersey Needs Your Vote

by Brian T. Lynch

I grew up a few blocks from Lake Hopatcong and the experience has stayed with me all my life. I learned to swim here. I learned to fish and ice fish here. It was fun and exciting in the summer. But the best gift of all was discovering my inner calmness in the reflections of countless sunsets and the gentle lapping of its waves. This is where I feel most at home.


A view from tiny Snake Island on the North end of Lake Hopatcong in the Fall of 2013 looking over to a nature preserve.

Which is why I am asking you to help the Lake Hopatcong Foundation win a small public grant. By casting a vote to win this grassroots grant from the Boat U.S. Foundation you may enable us to create a public guide map of this beautiful lake. To vote, please must click on the following link to vote for Lake Hopatcong to receive this grant:

THE VOTING IS OVER, THANK YOU FOR YOUR SUPPORT. WE ARE WAITING TO HEAR IF WE WON THE GRANT.  STOP BACK FOR THE ANSWER.

"But how does a guide map help this lake", you ask?

New Jersey politics is heavily comingled with the interests of developers. Over the years this beautiful lake has been transformed from summer resort and recreation area to largely a residential lake. Lake access has become too limited due to over development, so tourism is down. (I would love to see the State open another state park.) This gives the New Jersey State government less incentive to support environmental stewardship of our largest lake and natural attraction. Encouraging more tourism will help attract more attention to preserving and maintaining the lake.

If they win the grant, the Lake Hopatcong Foundation will create a Lake Hopatcong Guide Map. The map will include information on invasive species and the location of pumpout stations. The map will be available for free and printed on water-resistant, tear resistant and durable 12” x 18” paper. They will also update the Lake Hopatcong Guide app which is available for free download for iPhone, iPad and Android. Information on how to prevent aquatic hitchhikers and the locations of pumpout station will be added to the app and their website. This will facilitate visitor, encourage tourism and it would be good for the health of the lake in the long run.

Putting this small grant towards some great environmental issue would be a little bit like throwing a pail of water on a burning house. The impact would be negligible. So please help out and cast a vote for help the Lake Hopatcong Foundation win this small grant. Here is a little history of Lake Hopatcong. Please come visit it if you are in the vicinity some day.

LAKE HOPATCONG, NEW JERSEY


Lake Hopatcong is New Jersey's largest lake. It is about 4 square miles in area. It is in the water shed area know has the New Jersey highlands about 30 miles from the Delaware River and 45 miles from New York City. Lake Hopatcong was created by damming and flooding two ponds that were known as Great Pond and Little Pond. It is substantially spring fed while the Musconetcong River flows out from it.

The Big and Little Ponds in the Hopatcong basin were form during the last glacier. They were about two miles apart with some wetlands between. It is believed that these lakes were first settled by the Lenape Indians. Here they found that the lakes provided abundant fish and forested shores with plenty of game. The word "Hopatcong" is believed to be a derivative of the Lenape word "hapakonoesson", meaning Pipe stone".


Sometime between 1750 and 1765 the Brookland Forge and mill built a damn where the Musconetcong River flows from the lake in order to supply greater water power for the forge. This damn raised the water level by six feet and connected the two ponds. 

In the early 1800's plans were made to build the Morris Canal to connect the Delaware River with New York Harbor. The 900 foot elevation of Hopatcong basin was perfectly suited to supply water for the canal.

In 1831, the Morris Canal Company purchased the Brookland forge site and replaced the dam with one that raised the water 12 ft above the original level of Great Pond creating the lake as it exists today.


Lake Hopatcong is home to the greatest variety of game fish of lake in New Jersey.

Each spring it is stocked with brown trout, rainbow trout, and brook trout. It is home to Largemouth and smallmouth bass, rock bass, chain pickerel, channel catfish, bullheads, hybrid striped bass, walleye, muskellunge as well as perch, crappie, bluegill and carp.

I have never been skillful or lucky enough to catch one of the monster fish that inhabit the lakes depths, but I have always been inspired by those who do seem to catch these great fish.


Once a first class resort destination for the rich and famous, today Lake Hopatcong is largely a residential lake with limited public access. There is the New Jersey State Park in Landing and a number of marinas and restaurants on the lake and two yacht clubs. Many of the restaurants can be accessed by boat. You can simply dock and dine at any of these classic lakeside restaurants.


Jefferson House restaurant outdoor view


So again, Please help the Lake Hopatcong Foundation win this small grant, Click on the following link to vote for Lake Hopatcong to receive this grant: http://www.boatus.org/grants/vote.asp and Thank YOU!


Saturday, March 7, 2015

Republicans Having a Selma Moment


by Brian Lynch, MSW

It's been fifty years since marchers seeking voting rights were beaten on the Pettus Bridge in Selma Alabama, yet Republican leaders still can't join hands with African Americans on that bridge without offending bigots in their base. Fifty year later and a show of unity on that bridge is still the wrong message coming from the Republican Party? Really?

This begs further questions. Just how much of Republican politics is driven by the desire to preserve white privilege? What percentage of their base feel hostile towards inclusion and justice for all? And who can be surprised after this missed opportunity to learn that 90% of African Americans vote for Democrats, or that Latinos are increasingly turning to the Democratic Party?

Media pressure was put on the Republicans when it was learned that no leaders were planned to go to Selma. At the last minute House Republican Majority Leader Kevin McCarthy announced he will to join in the 50th anniversary events. McCarthy is a close friend of Democratic Congressman John Lewis who was beaten on that bridge 50 years ago. The cynical view is that McCarthy is the best Republican representative since his attendance can be forgiven by the bigots on the grounds that he is Lewis' personal friend. This isn't to impugn McCarthy's motives for attending, which I'm sure are genuine.

Political spinners can say whatever they want, but no rational citizen who wants our society to advance can accept any more excuses from those who hold us back. The Republican Party has clearly chosen the wrong side of history. This time it is Republicans who are beating themselves on the Edmund Pettus Bridge.

_________________________________________________

Historical foot note: The Edmund Pettus Bridge is named for Edmund Winston Pettus, a former Confederate brigadier generalU.S. Senator from Alabama and Grand Dragon of the Alabama Ku Klux Klan.

Thursday, February 26, 2015

The Plot to Kill Public Employee Pensions

by Brian T. Lynch, MSW

In war and politics, if you pick your battlefield you win. The current pension fight in New Jersey is a classic example. Nearly everyone in the state sees it as a battle between a broken pension system and cash strapped citizens, but this is all just a setup.

Governor Chris Christie cut $1.5 billion in pension payments from the latest budget proposal while also cutting modest tax increases on the rich to pay for it.  When the unions squealed, he offered the public a false choice between tax hikes on the middle class or cuts to popular and essential programs.  His framing of the problem this way pits average citizens against civil servants and their unions.  This is the battlefield of choice for national conservatives.

This fight could have been between government solvency and any other public obligation of the state, but it's not.  It's against public employee unions because killing public sector unions and fix pension systems has been a conservative priority for decades.  This is a grand plan playing out in many other states.  Starving public pensions was always a choice, not a necessity.  If all those missed pension payments had been made the system would be awash in cash today given the huge growth in the investment markets over the past twenty years. 

But Gov. Christie almost blew this plan to destroy public employee pensions in New Jersey when he enacted pension reforms that might actually fix the system.  His reform plan could still fix it if implemented, but not without seriously upsetting his potential conservative backers.


In order to keep his presidential hopes alive Governor Christie had no choice but to sabotaged his own reforms and further degrade the state pension system by not paying what he promised.  A state judge has seen through his shallow plan and ordered him to restore the cuts, and he has appealed. I hope the New Jersey Supreme Court will uphold the lower court's decision.  

I hope everyone else in New Jersey sees though his sham and demand that that he stick to the pension reform plan he has been boasting about on his trips out of state.  And if the reader here happens to live in a conservative state with public pension woes, take a lesson from New Jersey.  Take a step back and look around to see in whose battlefield you may be standing.

See also: Civil Service Pensions - A Marker for What We've Lost

Monday, February 16, 2015

HERE IS WHY GEORGE WASHINGTON IS WORTH CELEBRATING


HERE IS WHY GEORGE WASHINGTON IS 
WORTH CELEBRATING


George Washington warned this Nation about political parties that,"alternate domination of one faction over another, sharpened by the spirit of revenge, natural to party dissension, which in different ages and countries has perpetrated the most horrid enormities." He called political parties.."a frightful despotism."

He called plutocrats (wealthy, controlling capitalists) ,"powerful engines" of cunning and ambition that "subvert the power of the people and usurp, for themselves, the reins of government."

Because a democratic government is compelled to enact the will of the people he gave this advice: "Promote then, as an object of primary importance, institutions for the general diffusion of knowledge." He said, "In proportion as the structure of a government gives force to public opinion, it is essential that public opinion should be enlightened."

He denounced war that is coerced by "habitual hatred" and those who profit from it. He said "The nation, prompted by ill-will and resentment, sometimes impels to war the government, contrary to the best calculations of policy... The government... makes the animosity of the nation [towards war] subservient to projects of hostility instigated by pride, ambition and other sinister and pernicious motives."

And he made all of these comments in his Farewell Address, with the hope that we would still  be listening.

Thursday, January 22, 2015

A Best of Times, Worst of Times Economy

by Brian T. Lynch, MSW

How is it possible that the investment economy is booming while the economy of ordinary citizens is still in such a slump? Stock prices are at an all time high and big time investors are getting high rates of returns while worker wages have declined and are just starting to rise. The raises in wages so far is still not keeping up with inflation. It seems like there are two separate economies not entirely connected to each other. Right?


To understand what's happening we have to begin by acknowledging that most of the richest billionaires today have gotten much of their wealth increases at the expense of lower wages for the rest of us. This trend is more than thirty years old now in the United States. There is plenty of evidence supporting this fact for those who care to look. And this wage suppression is a global phenomenon, not just a U.S. feature.

In order to increase consumer spending while wages remained flat we have had to make a series of changes, beginning with mothers entering the workforce, longer work hours followed by layaway plans, credit cards and then home equity loans to pay for spending beyond our means. These have run their course and the long hard pay down of personal debt (including college loans) means that consumer spending will be sluggish for the foreseeable future.

The impact on the economy of stagnant wages is ever slower consumption of goods and services over time. There isn't as much money to buy things. This slower rate of consumption suppresses demand. Lower demand means fewer jobs and even lower wages for the rest of us. This is the cycle were we find ourselves today.

The consumption of goods produces the profits from which owners of capital collect returns on their investments. Lower demand due to suppressed wages would normally also lower returns on capital investments but for the factors that have kept consumption afloat. Now there are no hours left in a day, fewer household members available to work and no more capacity to borrow against future earnings. The impact of low wages has come home to roost and it means fewer sales and less profit to be made.

Before the 1970's this situation would right itself as owners shared a portion of their wealth by offering productivity raises to reward their workers. Productivity wages are based on growing productivity, hourly GDP, It is separate and apart from cost of living increases. Productivity raises, along with cost of living adjustments, allowed the labor/consumers to increase their spending thus boosting demand. Increased demand would spur on manufacturing and stimulate the whole economy.

But today's billionaires have found another way to profit without sharing their wealth with wage earning consumers. They spotted the growing ownership stake that many in the middle class have accumulated and they created opportunities to take it from them.

It is hard for most of us to see in our lifetime, but this is the first time in modern history that the middle class (upper-middle mostly) has accumulated a significant share in capital ownership. Prior to the vast destruction of property caused by the world wars in the last century, wealth was extremely concentrated at the top, and it's happening again today. Middle class gains in the 20th Century directly correspond to capital losses by the wealthiest owners during the two world wars. Now many of us have retirement accounts, money market funds, stock holdings, etc. People in the upper-middle class, such as doctors, lawyers and middle-managers, have become mini-investment capitalists.

Billionaire capitalists, the "true heirs" to wealth ownership, have responded to middle-class ownership of capital by creating a massive financial investment casino filled with elaborate new investment vehicles. The object is to entice new wealth owners to play in the billionaire's casinos. Mortgage backed securities and swaps are just two small examples that nearly bankrupted the economy in 2008.

These new and incomprehensible investment products has spawned a whole new class of hucksters, like Bernie Madoff, who use these bewildering new instruments to create slick ponzi schemes. But the bulk of these new investment opportunities are just big casino games in which the house (billionaire owners) always wins. Billionaires are quickly siphoning away middle class ownership stakes through high finance games of chance. In this way they boost their own return on investments and entertain themselves without having to share their wealth by offering higher wages.

Because these billionaire owners, who make up less than .01% of the population, control the investment odds, they are sure to win back all the capital their families lost in the war years of the last century.

This explains why the stock market and investment economy seem to be booming while the worker economy on Main Street slumps. Billionaire capitalists don't have to share wealth to make wealth like they use to. There are enough small investors with an ownership stake who are willing to gamble what little they have in this new investment casino. It is enough to keep billionaire fortunes growing faster than the economy as a whole.

If you, the reader, are still with me at this point let me assure you that the geometrically rising gains by the wealthiest owners of capital are not an inevitability. There are difficult but concrete steps we can take to bring capitalism back into balance for everyone. A discussion of these solutions, however, does require a much deeper understanding of problems that I can provide here. I firmly believe it is in everyone's best interest to acquire a better understanding of the forces creating our two economies; Forces that are threatening our democratic institutions. For a fuller understanding I recommend Thomas Piketty's excellent book, Capitalism in the 21st Century. I encourage you to strike up conversations with others and share your thoughts and questions.

_______________________________

Image Credit: (and recommended site) http://oxfamblogs.org/fp2p/is-doing-something-about-inequality-just-a-choice-between-bash-the-rich-v-tackling-poverty-some-thoughts-for-blog-action-day/#prettyPhoto-img/0/

Tuesday, December 23, 2014

Brooklyn Police Murders Don't Erase Decades of Differential Justice

by Brian T. Lynch, MSW

Eleven cops were killed in 2013 at the hands of black minority alleged perpetrators. Sixteen cops were killed by white alleged perpetrators last year. Half of all cop murders that have take place in the last ten years happened in the Southern United States.  (See table below)

One problem with the FBI statistics is they don't distinguish between African-American vs. black Latino or other black skinned minorities. Even so, African-American's make up 13% of the population but make up 28% of all arrests nationally and 40% of all US prison inmates. In some communities a black person is more than 10 times as likely to be arrested than a white person in the same town.

There clearly is differential policing in this country, but not in every community. There clearly are areas where police departments exhibit racial bias, but not everywhere, in every case by every officer.

Since the 1970's there is a significant decline in police fatalities, yet, with less than half of all law enforcement agencies reporting, there are about 400 civilian deaths caused by police each year. These are deaths considered to be justifiable police homicides. That number could be well over 1,000 per year if national reporting was mandatory for law enforcement. (see this petition)

I am horrified at the brutal murders of officers Wenjian Liu and Rafael Ramos in New York City. I am fully supportive of police and sympathize with their families. This is a sacrifice they should not have to bear.

The killer in this case appears to be mentally ill, having shot his ex-girlfriend before coming to NYC to kill some cops before killing himself. He wasn't one of the recent police protesters nor was he connected with any nefarious organizations that might considered "anti-law enforcement." (For the most part those organizations are far rightwing in their politics and Ismaaiyl Brinsley doesn't fit that profile) . The police are rightfully investigating this possibility as I write, but so far Brinsley seems to have acted alone.

The evidence so far suggests that this terrible killing was the result of mental illness and an anti-social personality disorder, not revenge. It should not be politicized in any way or used by the police or law enforcement officials as a reason to alter policing tactics towards those people who are lawfully protesting policing policies. blatantly unequal application of justice against minorities over the past 4 decades is a well documented fact. This incident should not be used by police departments across the country as a reason not to challenge them to change.


----------------------------------------------

Related Stories on this Blog

Three People Die in Police Custody Every Day
http://aseyeseesit.blogspot.com/2015/04/three-people-die-daily-in-police-actions.html

Police Action Fatalities in America
http://aseyeseesit.blogspot.com/2015/04/police-action-fatalities-in-america.html

New Data Exposes Racial Bias in Fatal Police Encounters Nationwide
http://aseyeseesit.blogspot.com/2015/04/new-data-exposes-racial-bias-in-fatal.html

Police Homicides, What We Know and Don't Know
http://aseyeseesit.blogspot.com/2014/09/police-homicides-what-we-know-and-dont.html

Serve and Protect or Enforce and Collect, The Changing Character of Local Police
http://aseyeseesit.blogspot.com/2014/06/serve-and-protect-or-enforce-and.html

Police Killings Not Uncommon, Exact Numbers Are Unknown
http://aseyeseesit.blogspot.com/2014/08/police-killings-not-uncommon-exact.html

Consequences of Militarized Police Departments in America
http://aseyeseesit.blogspot.com/2012/05/consequences-of-militarized-police.html

Stop-and-Frisk and Racial Profiling, What We Should Know

http://aseyeseesit.blogspot.com/2012/06/stop-and-frisk-and-racial-profiling.html

Counter